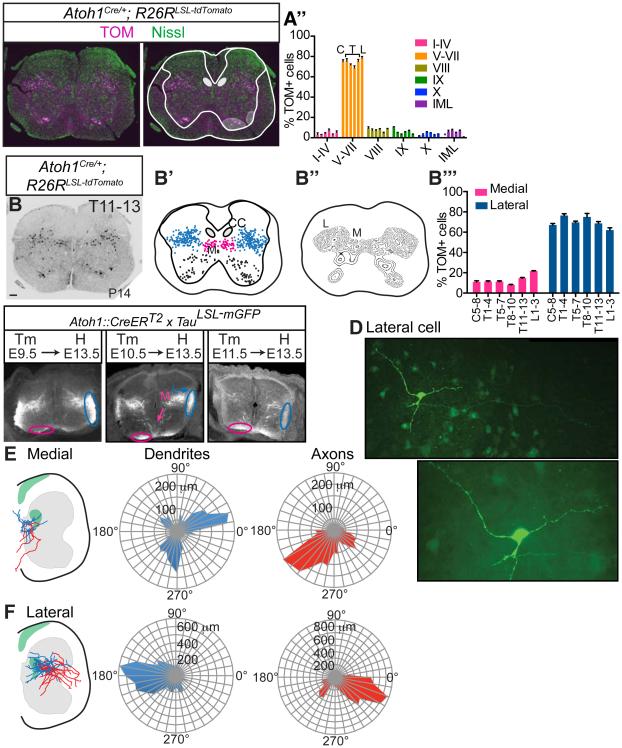
Figure 3. Atoh1-lineage neurons form a medial contralaterally-projecting and lateral ipsilaterally-projecting population.
(A-A’’) A majority of Atoh1-lineage neurons (TOM, magenta) reside in laminae V-VII (based on Nissl Neurotrace 488, green) throughout the rostral-caudal (r-c) axis (C, T, L bars represent C5-8, T1-4, T5-7, T8-10, T11-13, L1-3). Purple dot indicates no IML in the cervical region. (B-B’’) Atoh1-lineage cells (TOM+, black) cluster into a medial (M, pink) and lateral (L, blue) population. (B’’’) Percentage of TOM+ cells in the M and L populations out of total TOM+ cells throughout the r-c axis. Six consecutive sections for one spinal cord (T11-13) stacked onto one spinal cord representation is shown in B’. Six representative sections per spinal cord region per n=3 spinal cords counted in A’’ and B’’’. (C) Atoh1-lineage neurons are born from E9.5-E11.5 where the M population (M, pink) begins projecting contralaterally to the ventral funiculus (pink oval) and the L population (L, blue) begins projecting ipsilaterally to the lateral funiculus (blue oval). (D) Example of a biocytin-stained L neuron. The axon (arrowheads) branches from a major primary neurite (arrow) and projects toward the lateral funiculus (LF). (E) M neurons have axons that project contralaterally as assayed by biocytin staining. Soma are designated as the center of the polar coordinate plot. Total dendrite (blue) and axon (red) length of a compilation of medial neurons (n=6 cells) are shown in microns (μm) on a radial axis. (F) L neurons (n=17 cells) have axons that project to the ipsilateral lateral funiculus. Green areas in E and F indicate areas of Parvalbumin+ afferent density. Mean ± SEM shown. Scale bars are 100 μm. Abbr: Cervical (C), Thoracic (T), Lumbar (L), Clarke’s column (CC), Intermediolateral Nucleus (IML). See Figure S2 for r-c data.

