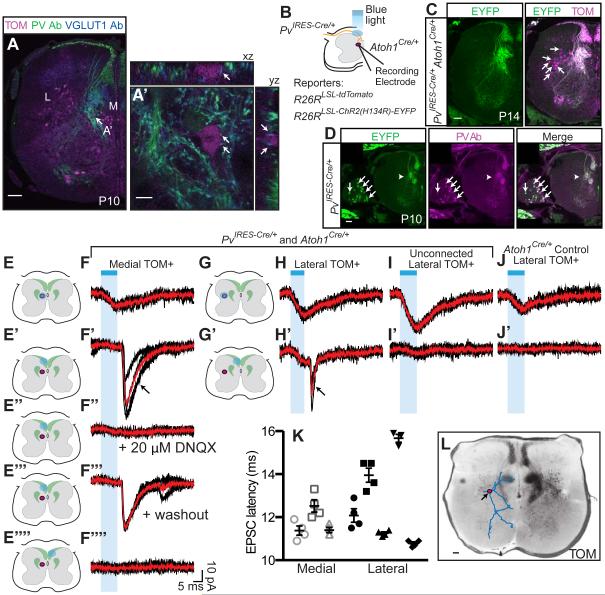
Figure 4. Atoh1-lineage neurons receive proprioceptive input.
(A - A ’ ) Proprioceptive afferents synapse on Atoh1-lineage neurons (TOM+, magenta) in the M population (Parvalbumin, PV+ (green) and VGLUT1+ (blue), arrows). (B) Proprioceptive afferents (PvIRES-Cre/+, yellow) and Atoh1-lineage neurons (Atoh1Cre/+, magenta) express tdTomato (TOM)(Ai14) and an EYFP fused channelrhodopsin (ChR2-EYFP) (Ai32). Atoh1-lineage cells are recorded while focal blue light is delivered to different areas of the spinal cord slice. (C) Proprioceptive axons express both ChR2-EYFP and TOM (white), while Atoh1-lineage neurons have higher TOM expression (arrows, magenta). (D) Proprioceptive afferents (PvIRES-Cre/+) expressing ChR2-EYFP (green) colocalize with PV antibody (magenta) in the dorsal root ganglion (arrows) and axons (arrowhead). (E-F’’’’) Focal blue light (blue dot) delivered to a M cell (magenta oval)(E) elicits a direct inward current (F) whereas blue light delivered to the contralateral dorsal funiculus (E’’’’, F’’’’) does not. A synaptic response seen when the ipsilateral dorsal funiculus is illuminated (E’, F’, arrow) is blocked by DNQX (E’’, F’’), and recovered upon washout (E’’’, F’’’). (G-H’) A L cell has a synaptic response when the ipsilateral dorsal funiculus is illuminated (G’, H’, arrow). (I-J’) Unconnected cells and Atoh1Cre/+ controls have no synaptic response. Cells were held at −60 mV in voltage clamp. Three to four repeated stimulation traces are shown in black. Average trace shown in red. PV+ axons (green) are shown schematically in E-E’’’’ and G-G’. (K) Latency of the excitatory postsynaptic current (EPSC) is shown for 3-4 repetitions of each recorded cell: M (n=3 cells, open markers), L (n=5 cells, closed markers). Mean ± SEM shown. (L) Dendritic tree (blue processes) of a L cell that received PV+ synaptic input overlayed on TOM+ (black). Lower thoracic sections are shown. Scale bars are 100 μm except 10 μm in A’. Abbr: Medial (M), Lateral (L).

