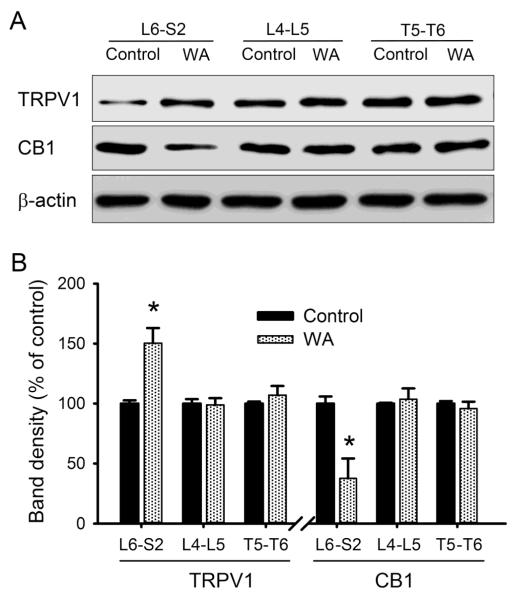
Fig. 1.
Western blot analysis revealed region-specific alterations of TRPV1 and CB1 receptors in DRGs in WA stressed rats compared with controls. (A) Typical blotting bands demonstrating the expression levels of TRPV1 and CB1 in T5-T6, L4-L5 and L6-S2 DRG regions. (B) Graph depicting the percentage changes in the receptor expression in DRGs from control and stressed animals (n = 5). Data are expressed as mean ± standard error. *, P < 0.05.

