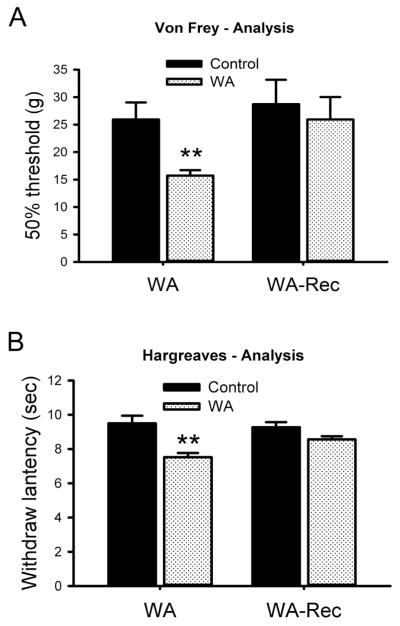
Fig. 7.
Line graphs show acute development of somatosensory pain in WA stressed rats compared with controls. (A) Comparison the differences in pain-related behaviors in response to mechanical (Von Frey test) stimuli in the hind paws of the control, WA and WA with 3-day recovery (WA-Rec) rat groups. (B) Comparison the differences in pain-related behaviors in response to thermal (Hargreaves test) stimuli in the hind paws of the control, WA and WA with 3-day recovery (WA-Rec) rat groups. Data are expressed as mean ± standard error, n = 6 in each group. **, P < 0.01.

