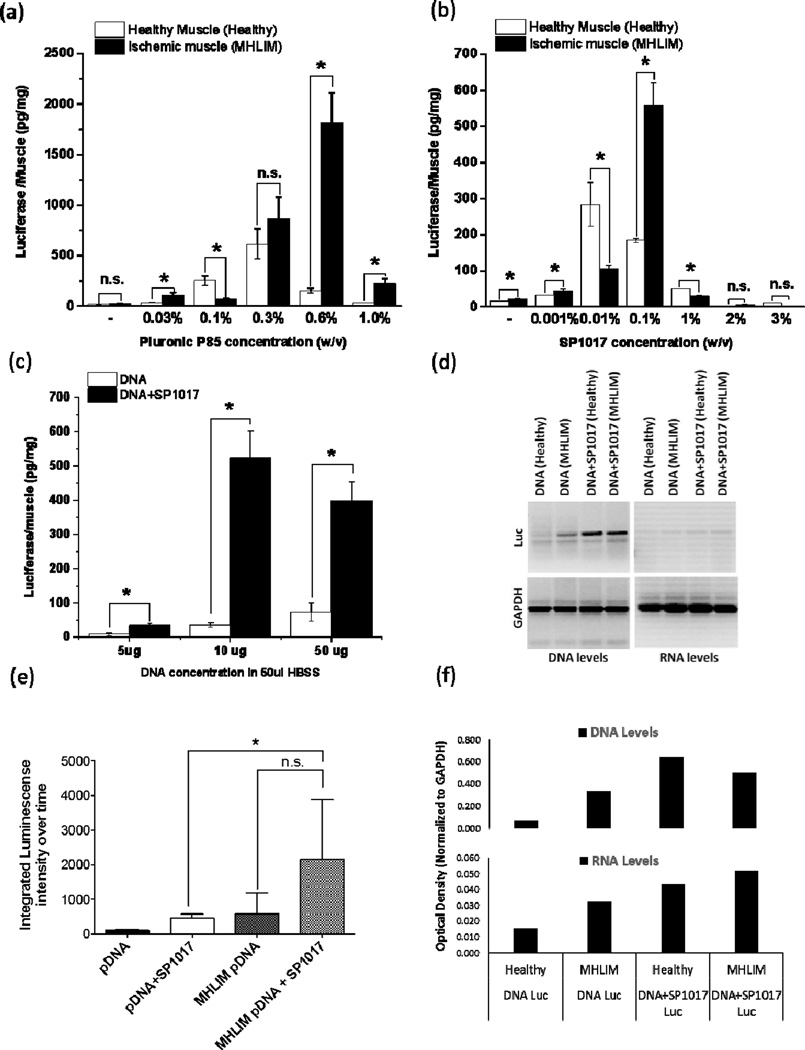
Figure 1. Effect of co-formulation of pDNA with Pluronic on the transgene expression (a-c, e), DNA and RNA levels (d, f) in healthy and ischemic skeletal muscles.
Luciferase expression (a-c, e) or DNA and RNA levels (d, f) in ischemic TA muscles of MHLIM (a-f) or normal TA muscles of healthy animals (a, b, d, e, f) after single injections of the pDNA, pDNA/P85, or pDNA/SP1017. (a-f) All injected solutions contained 10 µg gWIZ™ Luc pDNA in 50 µl HBSS with or without copolymers except (c) where the pDNA concentration was varied. (c-f) SP1017 concentration in injected solution was 0.1 % w/v. (a-d, f) Measurements were done on day 4 by tissue sampling. (e) The AUC 0 to 60 days of the time course of luciferase expression determined in live animals by quantifying the bioluminescence imaging data (see Fig. 2 in Ref. (24)) (a-c, e) Data are mean ± SEM (a-c) n = 5, pairwise comparisons using unpaired Student’s t-test with Welch’s correction * p < 0.05, n.s. – not significant, (e) n = 3–4, the AUCs for each individual animal have been calculated and analyzed using one-way ANOVA with Bonferroni correction for multiple comparisons (f) Data are relative optical density of luciferase DNA or RNA levels presented in (d).

