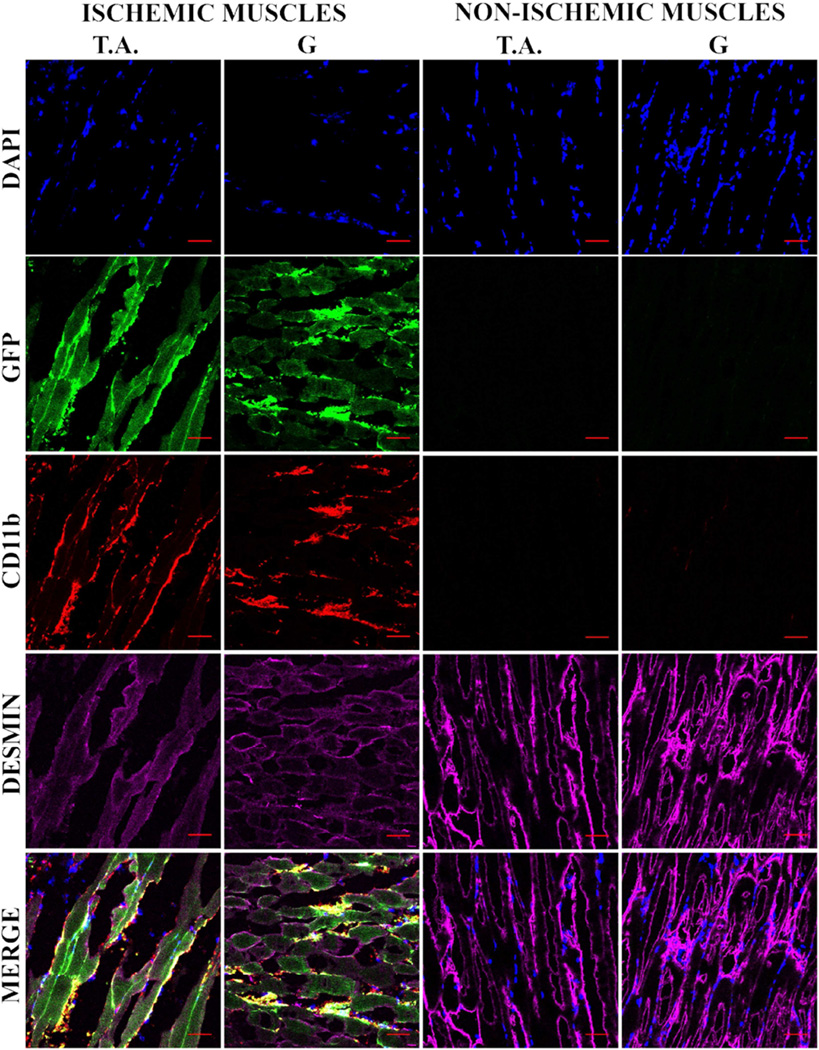
Figure 5. In vivo transfection of muscle cells upon adoptive transfer of GFP transfected MØs.
RAW 264.7 MØs transfected ex vivo with gWIZ™ GFP pDNA and administered i.j.v in MHLIM Balb/c mice (24 h after transfection, 48 h post ischemia surgery). Tissues (TA and G) were isolated 3 days thereafter and 10 µm thick sections of frozen tissues were processed for IHC. The color staining corresponds to nuclear DAPI (blue), GFP (green), CD11b (red) and desmin (magenta). The bottom panels present digitally superimposed images of preceding panels to visualize the co-localization (yellow or white). The images (20 ×) are representative of 3 sections per muscle and 3 mice per group. Scale bar = 50 µm.

