Figure 3.
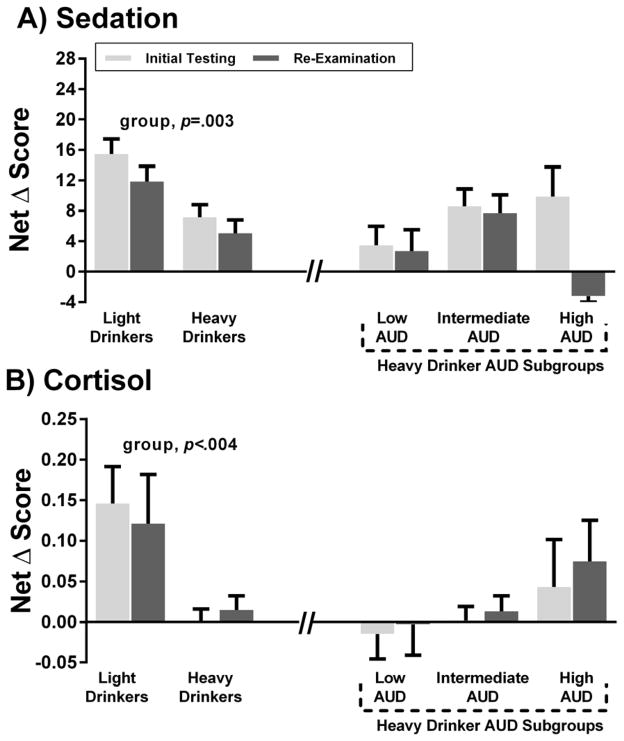
Figure 3A–B. Alcohol sedation and cortisol response at initial and re-examination phases.
Data are shown for light (n=70) and heavy drinker groups (n=86), as well the heavy drinker AUD trajectory subgroups, including low AUD (n=26), intermediate AUD (n=51), and high AUD (n=9). Fig 3A is the net change score (alcohol session peak BrAC minus baseline change score minus the same change score for the placebo session) for the BAES sedation and Fig 3B is the net change score (alcohol session 180 minutes minus baseline change score minus the same change score for the placebo session) for salivary cortisol levels; three outliers (two > 3 SD above mean, one <3 SD below mean) were removed in this analysis. GEE results are depicted for group effects.

