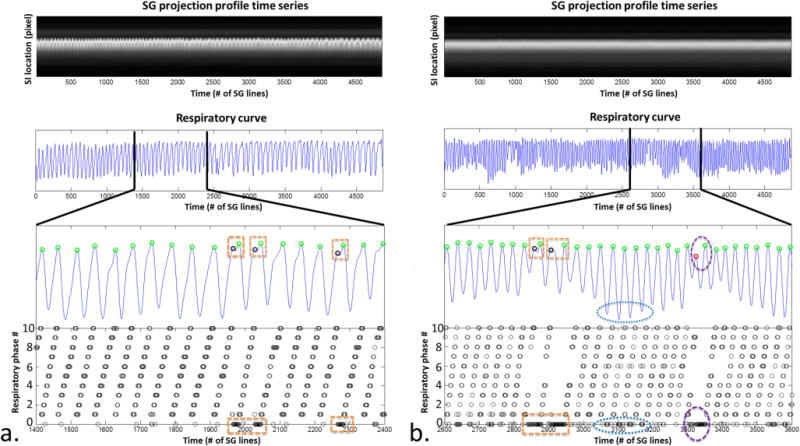
Figure 3.

Retrospective respiratory phase sorting in k-space demonstrated in a healthy volunteer (a) and a patient (b). The superior-inferior (SI) respiratory motion displacements represented in the respiratory curve were extracted via a principle component analysis (PCA) based method and served as a surrogate for respiratory phase throughout the acquisition (position index vs. time). Each peak (circle), representing end-expiration, was identified. Projection group outliers such as those involved in the respiratory cycles with abnormal time period (rectangle) and inconsistent expiratory amplitude (vertical oval) or those with large respiratory phase drift (horizontal oval) were discarded while only valid projection groups were assigned to respiratory phases between 1 and 10, shown as the black circles on the bottom graph. As shown here, the healthy volunteer showed a relatively stable breathing pattern, while the patient showed occasional irregularities.
