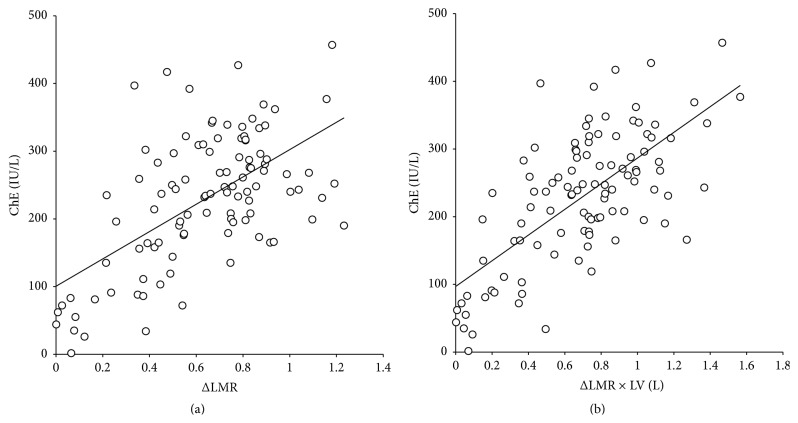
Figure 2.
Scatterplot showing the relationship between (a) ΔLMR and ChE and (b) ΔLMR × LV and ChE (n = 103). (a) The regression analysis yielded the following standard formula (solid line): ChE = 201.9 × ΔLMR + 100.5 (correlation coefficient = 0.590; p < 0.01). (b) The regression analysis yielded the following standard formula (solid line): ChE = 189.7 × ΔLMR × LV + 97.0 (correlation coefficient = 0.681; p < 0.01). The correlation coefficient between ΔLMR × LV and ChE was significantly higher than that between ΔLMR and ChE.

