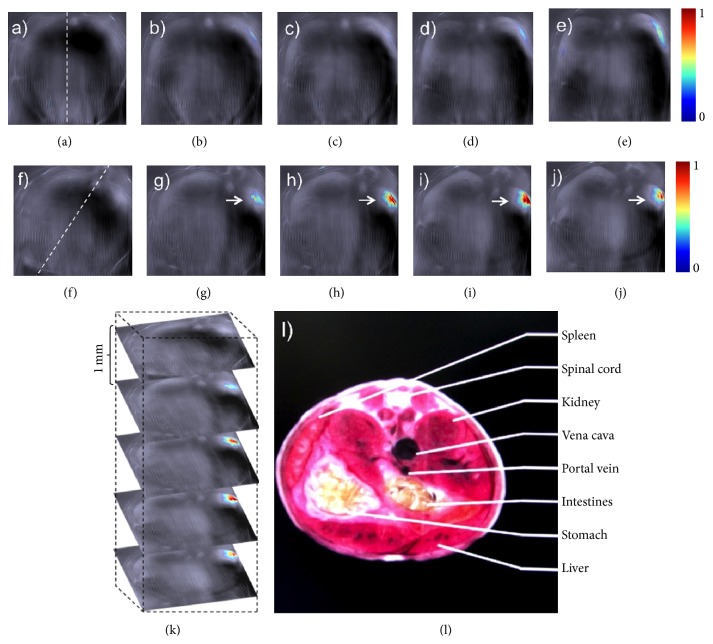
Figure 3.
Photoacoustic molecular imaging of mice in vivo based on the lanthanide upconversion nanoparticles (UC-α-CD). ((a)–(e)) Generated slice images of live mice before UC-α-CD injection. ((f)–(j)) 35 minutes after injection. Dashed lines in (a) and (f) displayed positions of the mouse while (g)–(j) showed the localized UC-α-CD. (k) 3D rendering of scanned region. (l) Schematic sections related to analysis region. Reproduced with permission from [20].

