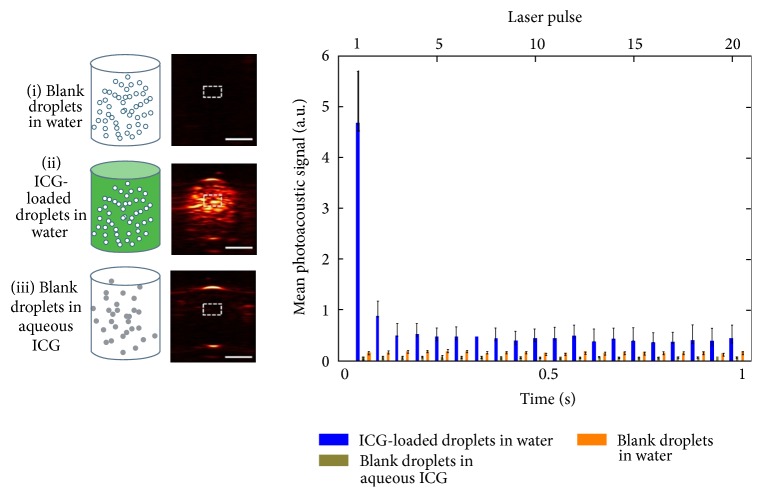
Figure 4.
Photoacoustic molecular imaging of ICG-loaded droplets. (i) Blank droplets in water, (ii) ICG-loaded droplets in water, and (iii) blank droplets in aqueous ICG. The right panel plotted the mean photoacoustic intensity identified in the defined ROI. Error bar represents the mean ± standard deviation. N ≥ 3 for all reported values; scale bar = 2 mm. Reproduced with permission from [23].

