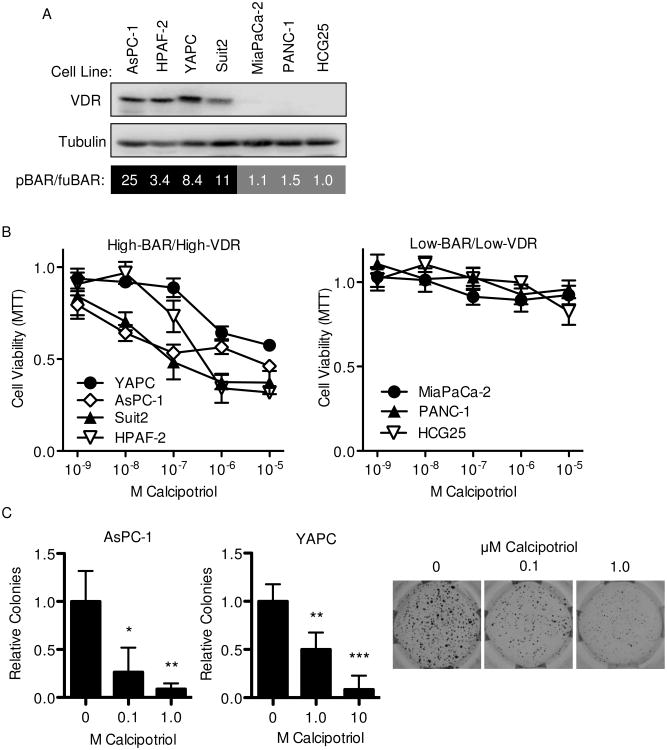
Figure 1.
Inhibition of pancreatic cancer growth by calcipotriol correlates with levels of VDR expression and autocrine Wnt/β-catenin signaling. (A) Western blot for VDR and tubulin (loading control) and mean Wnt reporter activity as indicated by BAR/fuBAR ratios and measured by dual luciferase assays 48 hours after co-transfection with control Renilla and either BAR-luciferase or fuBAR-luciferase reporter constructs in indicated PDAC cell lines (n=3 biological replicates). (B) MTT growth assays (measured at 72 hours) and (C) soft agar colony formation at indicated concentrations of calcipotriol. Representative images of AsPC-1 soft agar colony formation are also shown. Data are normalized to vehicle only and reported as mean ± standard deviation (SD) with one representative experiment of 3-5 biological repeats shown. *P<0.05, **P<0.01, ***P<0.001.

