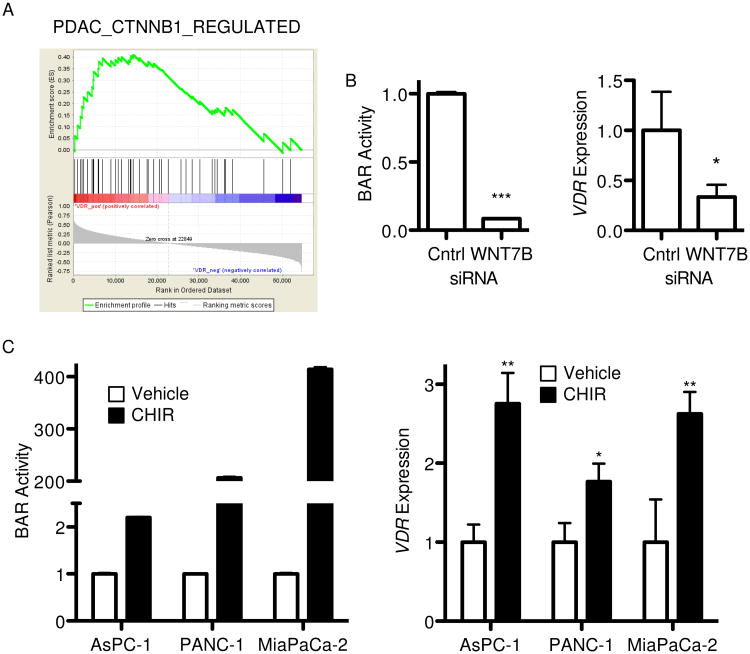
Figure 5.
VDR is regulated by Wnt signaling in PDAC. (A) Gene set enrichment analysis(27) enrichment plot for PDAC-specific Wnt/β-catenin target gene set determined relative to VDR expression phenotype using a published gene expression microarray dataset of 25 primary PDAC tumor samples. The top curve shows a running enrichment score for the target gene set, while the middle portion shows a heatmap of VDR expression (red – high, blue – low) and bottom portion shows the value of the ranking metric down the list of genes. (B) BAR luciferase activity and VDR expression by qPCR48 hours after transfection of AsPC-1 cells with control or WNT7B siRNA. (C) BAR luciferase activity and VDR expression by qPCR 24 hours after treatment of indicated PDAC cell lines with vehicle or 5 μM CHIR99021 (CHIR). Values are shown normalized to respective controls, with BAR reported as mean ± SD and qPCR reported as mean ± SEM. One representative experiment of 3 biological repeats is shown. *P<0.05, **P<0.01, ***P<0.001.

