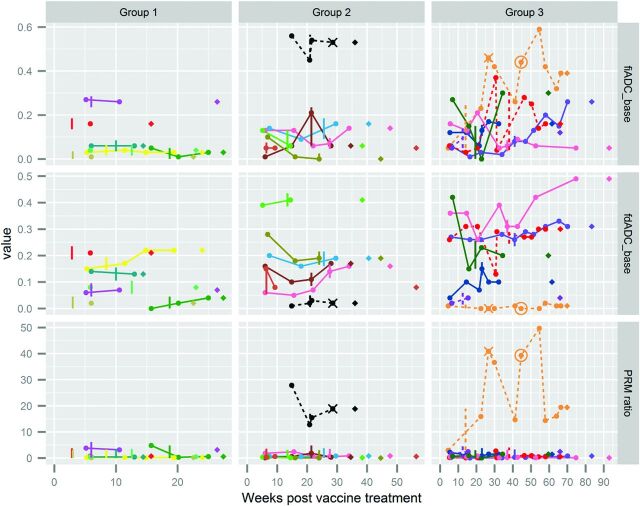
Fig 3.
Serial PRM metric and disease trajectories for 21 pediatric patients with brain stem gliomas. Although the patients were on a treatment trial with scheduled follow-up, imaging time points varied due to scheduling windows and use of DWI. Serial PRM metrics for each patient are shown, with colored lines connecting PRM results for each subject's nonbaseline time points. Columns divide patients into groups by increasing overall survival from the start of vaccine therapy (14–27 weeks, 28–56 weeks, 57–93 weeks). Rows display fractional increased ADC, fractional decreased ADC, and PRMratio compared with the baseline (prevaccine) scan. Each PRM measurement is indicated by a circle, connected by solid lines for patients without pseudoprogression and dashed lines for patients with eventual diagnosis of pseudoprogression. Vertical lines indicate the date of the last vaccine for each patient. For 2 patients with psuedoprogression, vaccine treatment was restarted (date shown as X) 8 and 13 weeks after the initial halt. One of these patients underwent a second treatment stoppage (date shown as a circle). If one examined the time from the last vaccine dose (vertical line or circle for the patient who restarted therapy) to death (♢), patients survived 4–56 weeks after halting vaccine therapy.

