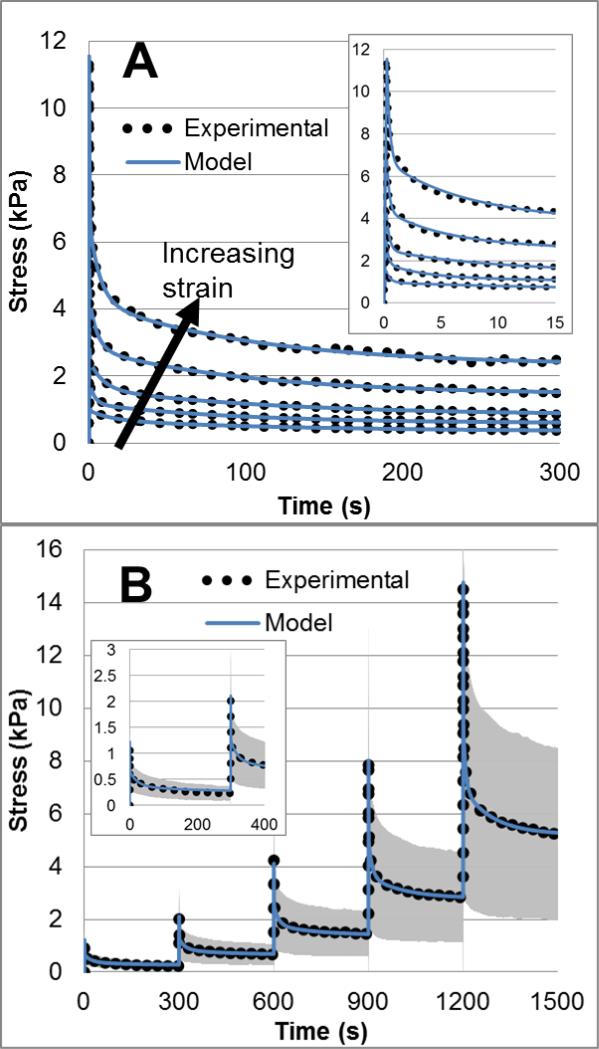
Figure 3.
Viscoelastic Prony fitting to five isolated stress relaxation steps of a single specimen (A), with loading and initial relaxation shown inset. Arrow indicates curves go from lowest strain level on bottom to highest on top. Nonlinear hyperviscoelastic fitting to mean experimental data (B) with initial steps shown inset for clarity.

