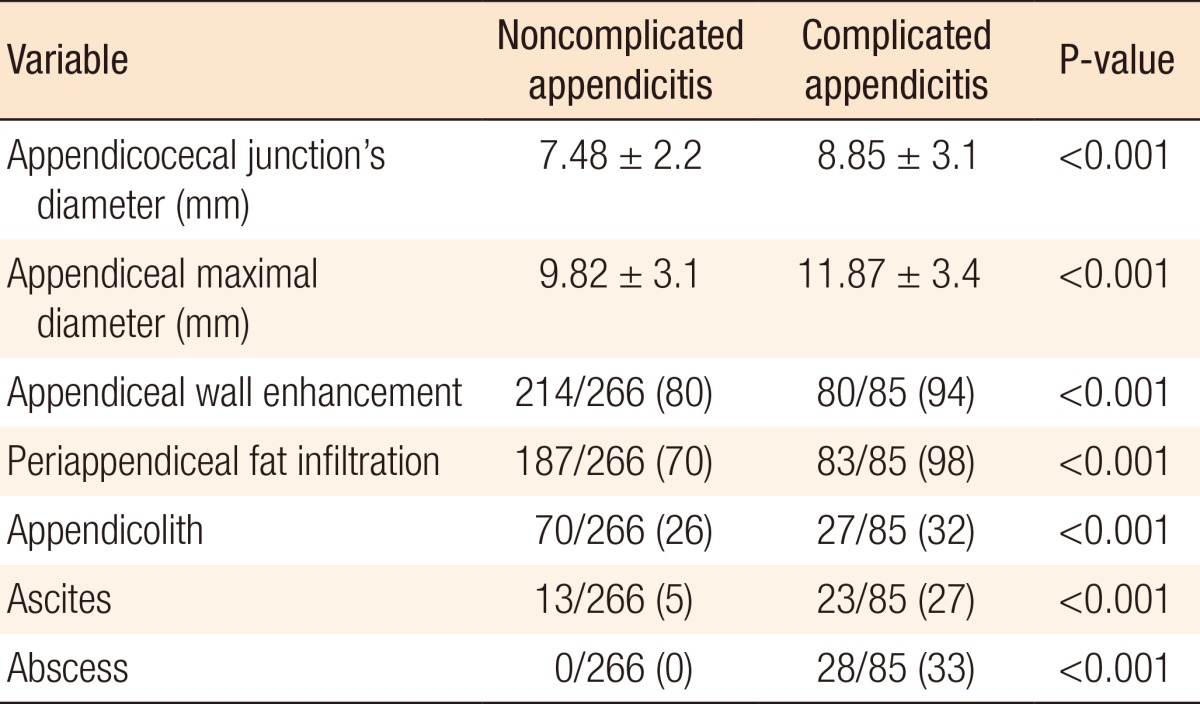
Table 2. Univariate analysis of computed tomography findings (noncomplicated appendicitis vs. complicated appendicitis).

Values are presented as mean ± standard deviation or number (%). The number of patients with noncomplicated appendicitis was the sum of those with a normal appendix and those with acute appendicitis without perforation or gangrenous changes on the pathologic findings. The number of patients with complicated appendicitis was the sum of those with acute appendicitis with perforation or gangrenous changes on the pathology findings and those with a periappendiceal abscess on the operative findings.
