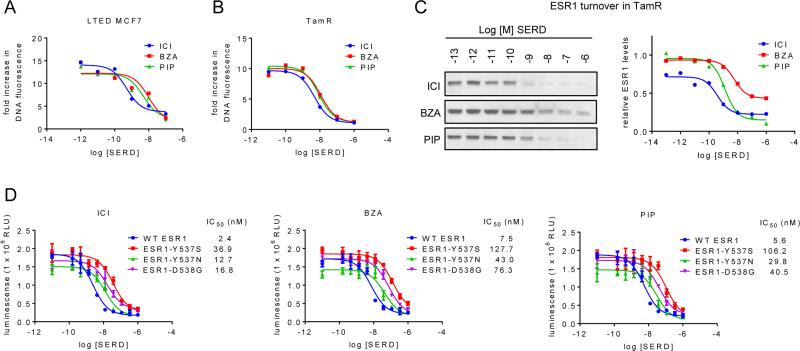
Figure 2. Fulvestrant, bazedoxifene, and pipendoxifene inhibit ESR1 activity in relevant models of endocrine therapy resistant breast cancer.
A) LTED MCF7 cells were plated in phenol red free media supplemented with FBS that was stripped of growth factors twice using charcoal. Cells were treated with ICI, BZA, and PIP (10−12 – 10−7 M) on days 1, 4, and 6 of an 8 day proliferation assay and analyzed as in Figure 1. B) TamR cells were plated in media supplemented with CFS 24 hours prior to treatment, and were treated with 1nM E2 as well as with ICI, BZA, and PIP (10−11 – 10−6 M) on days 1, 4, and 6 of an 8 day proliferation assay. Cell proliferation was quantitated as in Figure 1. C) TamR cells were plated in phenol red free media supplemented with charcoal stripped FBS 48 hours prior to treatment with ICI, BZA, or PIP (10−13 – 10−6 M) for 24 hours. Expression of ESR1 (C) and loading control cytokeratin 18 (CK18 – Suppl. Figure 2A) in whole cell extracts were detected by immunoblot (left). ESR1 levels relative to CK18 were quantitated by densitometry using Adobe Photoshop (right). D) MCF7 cells engineered to express wt ESR1 or Y537S, Y537N, or D538G mutations of ESR1 were treated for 7 days with increasing (10−11 – 10−6 M) concentrations of ICI, BZA, or PIP. DNA content, as assessed by luminescence (Cell Titer Glo assay), serves as an indicator of cell number in each condition. Data represent average detection +/− SD of triplicate wells. Data are representative of at least 3 independent experiments. IC50 values listed in the figure legend were calculated by non-linear curve regression using GraphPad Prism 6.

