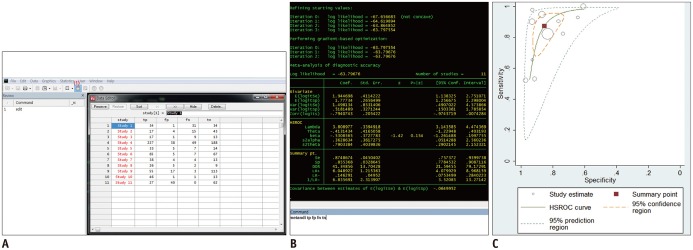
Fig. 2. Example of meta-analysis with hierarchical modeling (method currently recommended). Metandi module in STATA is used.
A. Data input. Simply click data editor button (1) and enter data in Data Editor window (2). B. Calculation of summary estimates. Summary estimates of sensitivity, specificity, DOR, LR+, and LR- can be obtained using command "metandi tp fp fn tn". C. HSROC curve is obtained using command "metandiplot tp fp fn tn". Circles represent estimates of individual primary studies, and square indicates summary points of sensitivity and specificity. HSROC curve is plotted as curvilinear line passing through summary point. 95% confidence region and 95% prediction region are also provided. DOR = diagnostic odds ratio, HSROC = hierarchical summary receiver operating characteristic, LR = likelihood ratio

