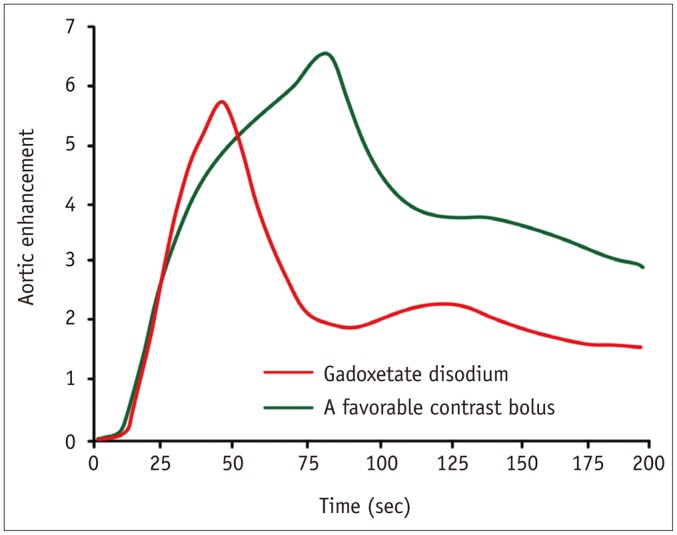
Fig. 1. Simulated contrast enhancement curve of abdominal aorta and liver.

Small amount of administered volume and gadolinium content of gadoxetate disodium (red line) can potentially shorten enhancement duration of contrast bolus and decrease magnitude of peak enhancement of contrast bolus compared with favorable contrast bolus curve (green line). This shape of gadoxetate disodium curve (red line) can pose challenges in capturing optimal arterial phase imaging.
