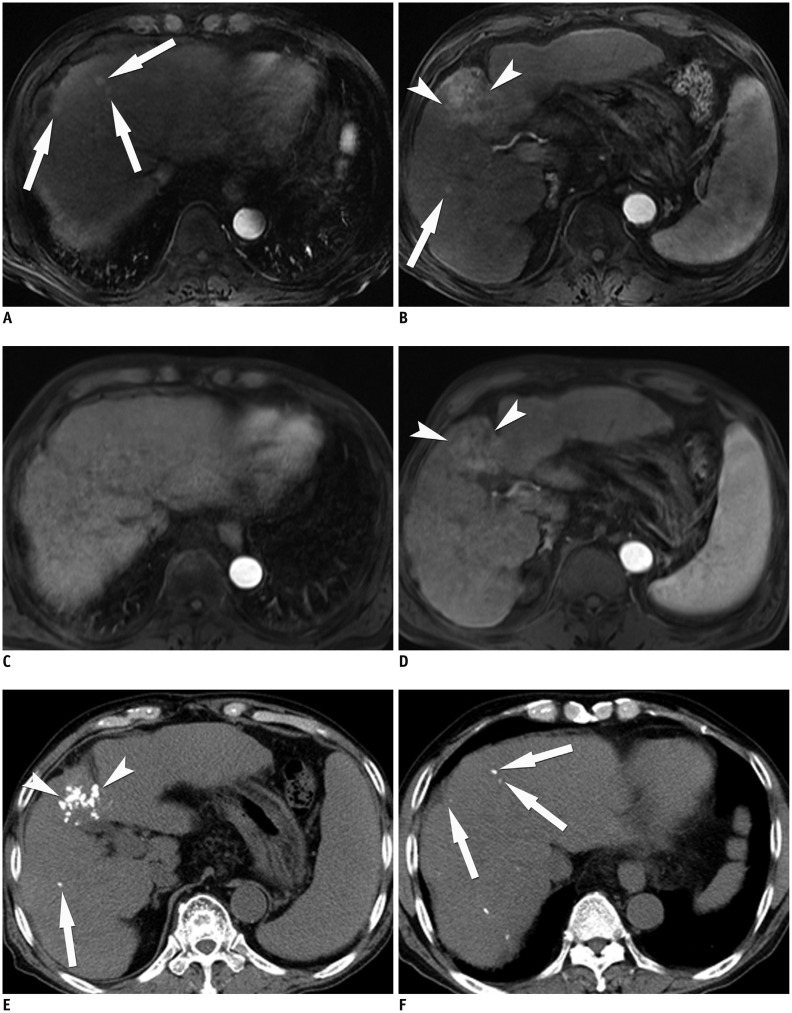
Fig. 3. 71-year-old man who underwent liver MRI both at 1.5T and 3T in one-week interval.
On arterial phase images at 3T (A, B), four more lesions (arrows) as well as large hypervascular tumor (arrowheads) are additionally detected, whereas on 1.5T MR images (C, D), only main lesion (arrowheads) is found. Lesions look more conspicuous on 3T MR images (A, B) than they do 1.5T MR images (C, D). Non-enhanced follow-up CT images (E, F) after transarterial chemoembolization demonstrate lipidol uptakes on four small lesions (arrows) and main lesion (arrowheads).

