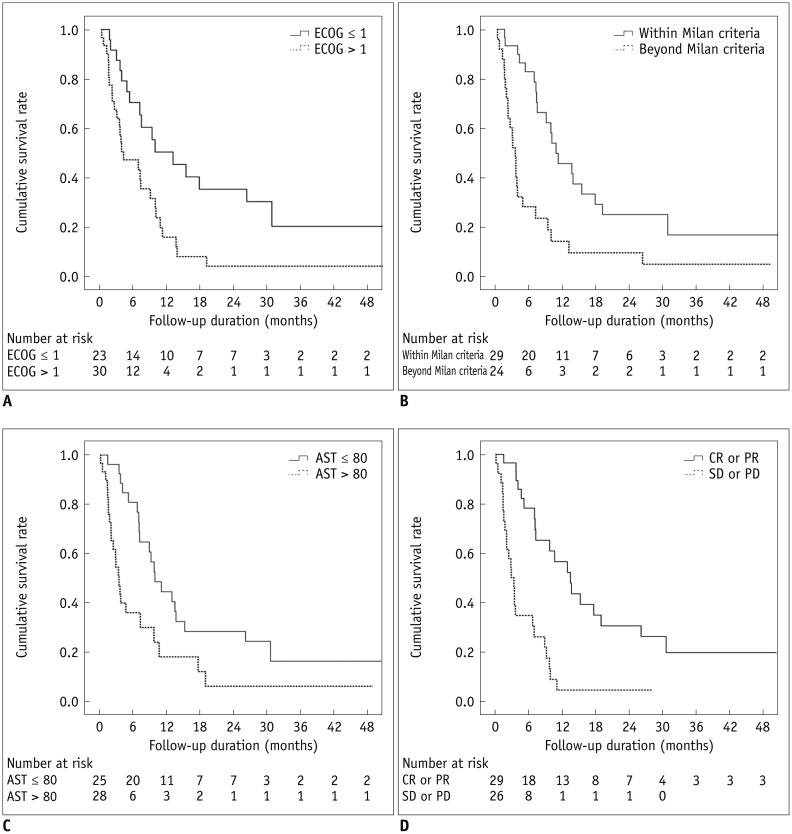
Fig. 2. Cumulative survival rates according to prognostic factors.
A. Survival curves of patients whose ECOG performance status was 1 vs. more than 1 (median survival time, 12.9 months; 95% CI, 4.3-21.5 vs. 4.0 months; 95% CI, 0-8.2, p = 0.003). B. Survival curves of patients whose tumor burden was within Milan criteria vs. beyond Milan criteria (median survival time, 10.6 months; 95% CI, 6.2-15.0 vs. 3.3 months; 95% CI, 2.5-4.1, p < 0.001). C. Survival curves of patients with serum aspartate aminotransferase levels ≤ 80 IU/L vs. > 80 IU/L (median survival time, 9.8 months; 95% CI, 6.8-12.9 vs. 3.4 months; 95% CI, 2.4-4.4, p = 0.004). D. Survival curves of patients with presence of tumor response (complete or partial response) vs. absence of tumor response (stable or progressive disease) (median survival time, 13.4 months; 95% CI, 8.8-18.1 vs. 2.8 months; 95% CI, 1.8-3.9, p < 0.001). AST = aspartate aminotransferase, CI = confidence interval, CR = complete response, ECOG = Eastern Cooperative Oncology Group, PD = progressive disease, PR = partial response, SD = stable disease

