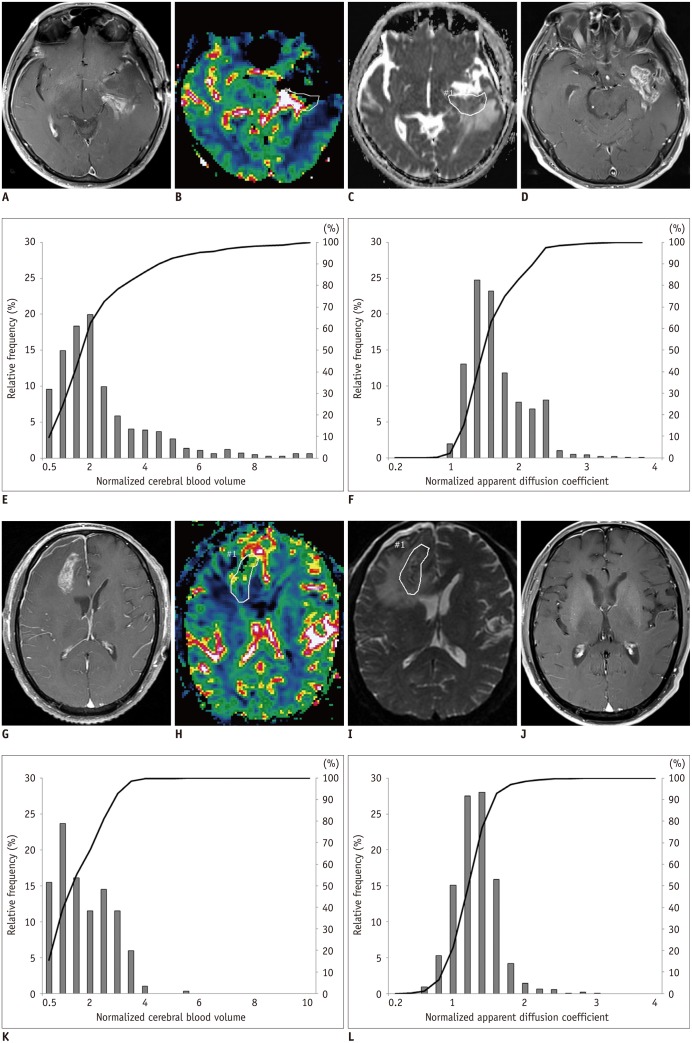
Fig. 1. Representative example of MR images, nCBV maps, nADC maps and corresponding histograms in 70-year-old man with progression and in 60-year-old man with non-progression.
A. Contrast-enhanced T1-weighted MR imaging obtained immediately after gross total resection from 70-year-old man shows measurable enhancement at posterior aspect of tumor resection margin. B. nCBV map shows increased nCBV with (C) slightly decreased ADC in enhancing lesion. E. Normalized CBV histograms and cumulative histograms of enhancing lesion. Histogram for entire contrast-enhancing lesion shows higher frequency of high nCBVs compared with 60-year-old man (K). F. Normalized ADC histograms and cumulative histograms of enhancing lesion. D. According to follow-up MR images acquired after adjuvant TMZ, there was increase in enhancement of lesion and patients were confirmed as progression. nADC = normalized apparent diffusion coefficient, nCBV = normalized cerebral blood volume, TMZ = temozolomide G. Contrast-enhanced T1-weighted MR imaging obtained immediately after gross total resection from 60-year-old man shows measurable enhancement at posteroinferior aspect of tumor resection margin. H. nCBV map shows slightly increased nCBV with (I) slightly decreased ADC in enhancing lesion. K. Normalized CBV histograms and cumulative histograms of enhancing lesion. L. Normalized ADC histograms and cumulative histograms of enhancing lesion. J. According to follow-up MR images acquired after continuing adjuvant TMZ, enhancement of lesion was decreased and patients were confirmed as non-progression. nADC = normalized apparent diffusion coefficient, nCBV = normalized cerebral blood volume, TMZ = temozolomide

