
Fig. 2. Kaplan-Meier curves between two groups of patients classified according to cutoff value of 5.537 for C99 of cumulative nCBV histograms (nCBV C99).
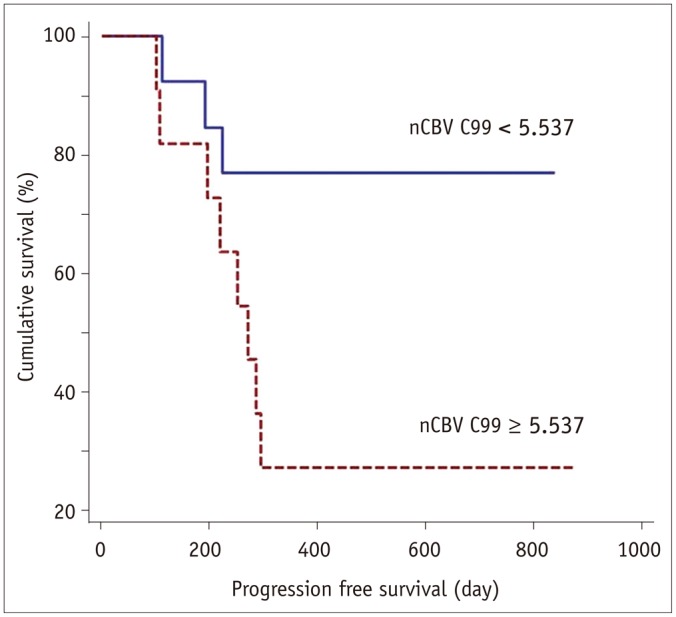
Significantly better outcomes were noted in group with nCBV C99 less than cutoff value (p = 0.026). nCBV = normalized cerebral blood volume