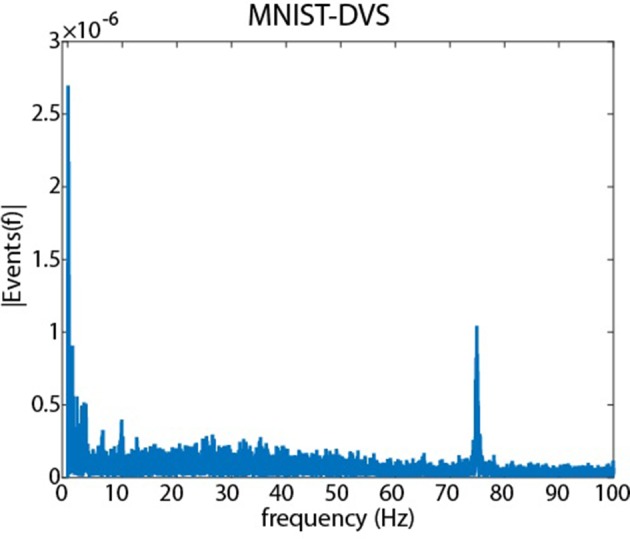
Figure 1.

A Fourier analysis of the MNIST-DVS dataset showing the amplitude of different temporal frequencies in the recordings. The 0 Hz component has been removed, and the energy in the signal has been normalized to 1 by dividing by the l2 norm. Clear peaks are observed at low frequencies due to the slowly varying motion of the digits on the monitor. A significant peak is observed at 75 Hz due to the discontinuous motion presented to the sensor as a result of the 75 Hz monitor refresh rate.
