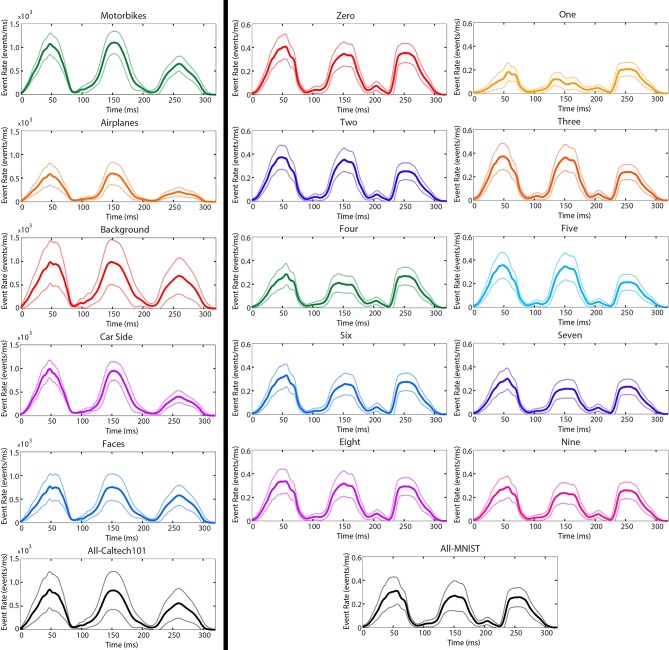
Figure 6.
The mean (solid) and standard deviation (transparent) event rates per μs for popular N-Caltech101 categories (left) and the N-MNIST dataset (right). The three peaks in each plot correspond to the three saccades. As expected from Equation (2), the maximum event rates occur near the middle of each saccade when the rotational velocity is highest.

