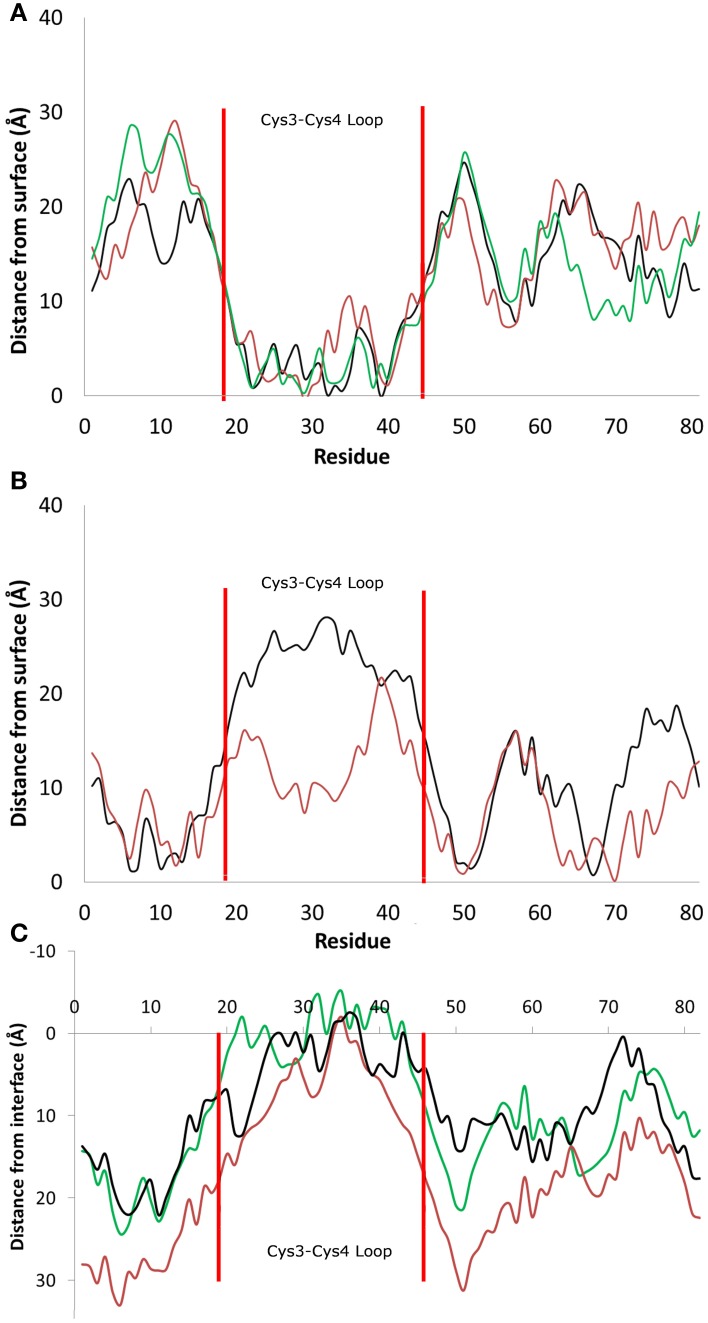
Figure 2.
Distance between the center of mass of residues and the average height of the surface hydroxyl groups for systems that adsorbed (A) through the Cys3-Cys4 loop (Residues 19 to 45, Binding Motif 1) and (B) with the Cys3-Cys4 loop in bulk water (Binding Motif 2). (C) Distance between the center of mass and the average profile of the air-water interface. Different colors represent the initial protein orientation as shown in Figure 1. In Binding Motif 1, black and green colors were from orientation (A), red from orientation (D). In Binding Motif 2, red was from orientation (D) again, and black was from orientation (C).

