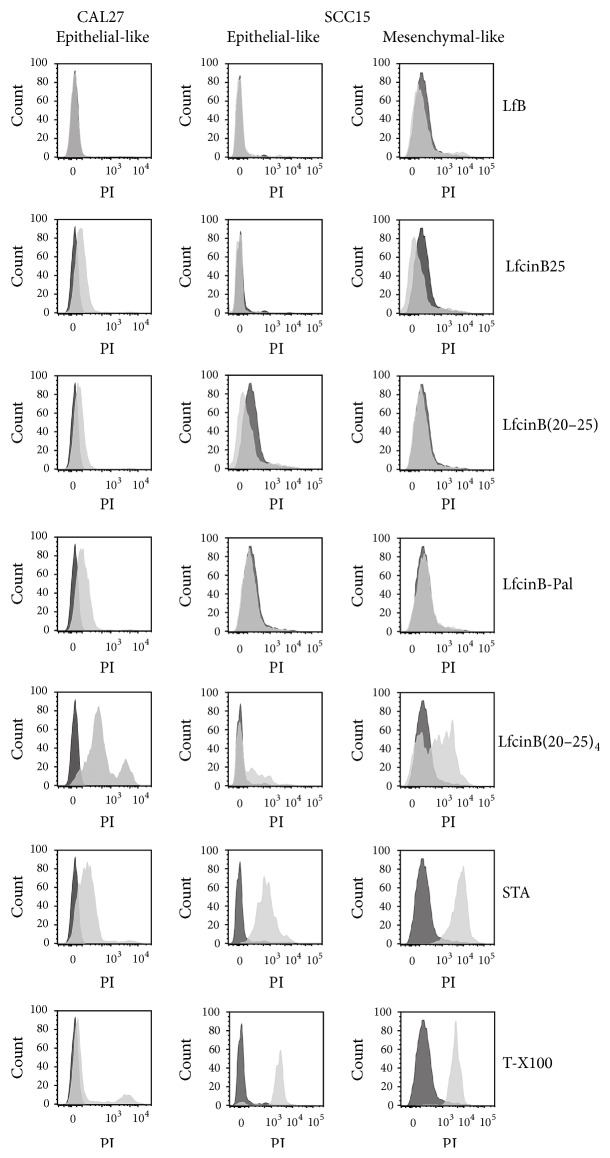
Figure 5.
PI permeability in CAL27 and SCC15 cell lines evaluated by FACS. Cells were incubated with the different peptides for 1 h, after which they were harvested and incubated with PI in the dark for 10 min. Black plot: controls without treatment; gray plot: 1 hour of treatment with peptides, or 2.14 μM (1 μg/mL) STA control or 0.2% T-X100 control. The maximum concentration of the peptides used was 100 μg/mL equivalent to LfcinB25, 32 μM; LfcinB(20–25), 101.5 μM; LfcinB-Pal, 67.3 μM; and LfcinB(20–25)4, 22.25 μM.

