. 2015 Oct 28;89(5):233–239. doi: 10.4174/astr.2015.89.5.233

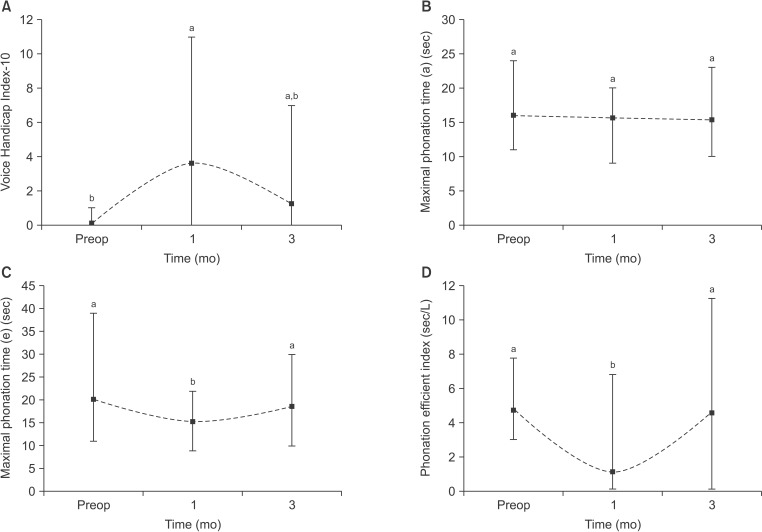
Fig. 1. (A) Comparison of the Voice Handicap Index-10 (VHI-10) preoperatively (preop) and at 1 and 3 months postoperatively. The VHI-10 showed a change of voice over time (0.1 vs. 3.6 vs. 1.3); however, this was not statistically significant (P = 0.056). VHI-10 normalized at 3 months postoperatively compared with VHI-10 preoperatively. Squares indicate mean and bars indicate minimum to maximum range. (B) Comparison of maximal phonation time (MPT) (a) preoperatively and at 1 and 3 months postoperatively. MPT (a) showed no significant change over time (16.0 vs. 15.6 vs. 15.4) (P = 0.889). Squares indicate mean and bars indicate minimum to maximum range. (C) Comparison of MPT (e) preoperatively and at 1 and 3 months postoperatively. MPT (e) showed no significant change over time (20.1 vs. 15.4 vs. 18.5) (P = 0.174). Squares indicate mean and bars indicate minimum to maximum range. (D) Comparison of phonation efficient index (PEI) preoperatively and at 1 and 3 months postoperatively. A significant change of PEI over time was observed (4.8 vs. 1.1 vs. 4.6) (P = 0.036); however, PEI normalized at 3 months postoperatively. Squares indicate mean and bars indicate minimum to maximum range. a,bsymbol of post hoc analysis.

Fig. 1