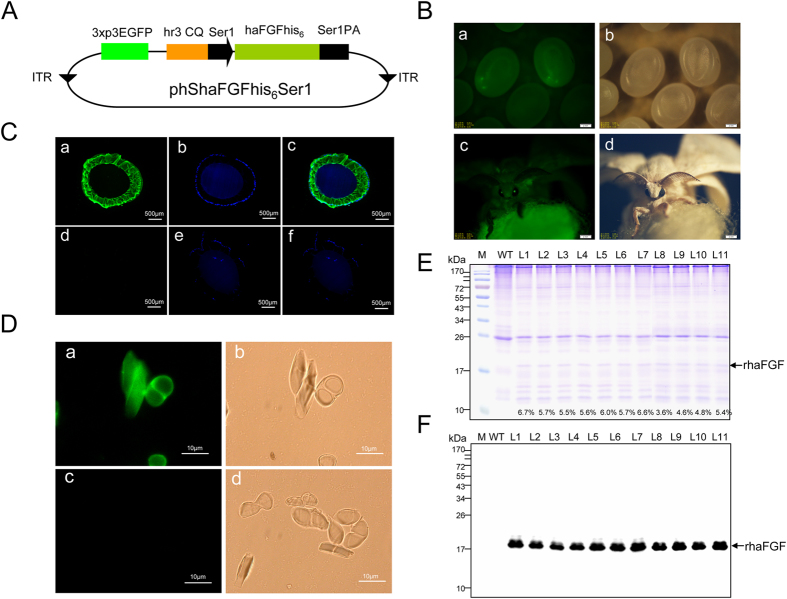
Figure 1. Generation of haFGF transgenic silkworm and the expression analysis of recombinant proteins.
(A) Structure map of the transgenic vector. (B) Fluorescent images of the transgenic silkworm in egg (a,b) and moth (c,d) stages, the scale bar represents 2 mm. (C) Immunohistochemical analysis of MSG cross sections of transgenic silkworm (a–c) and non-transgenic silkworm (d–f). The green fluorescence represents the immunoblot signals of haFGF proteins; the DAPI stained by blue fluorescence represents the cell nucleus. Scale bar represents 500 μm. (D) Immunohistochemical analysis of raw silk cross sections of transgenic silkworm (a,b) and non-transgenic silkworm (c,d). Scale bar represents 10 μm. (E) SDS–PAGE analysis of the cocoon proteins from ten different transgenic lines; the percentages represent the haFGF content of each line in the total cocoon extracts. (F) Western blot analysis of the haFGF in cocoon extracts from ten different transgenic lines.

