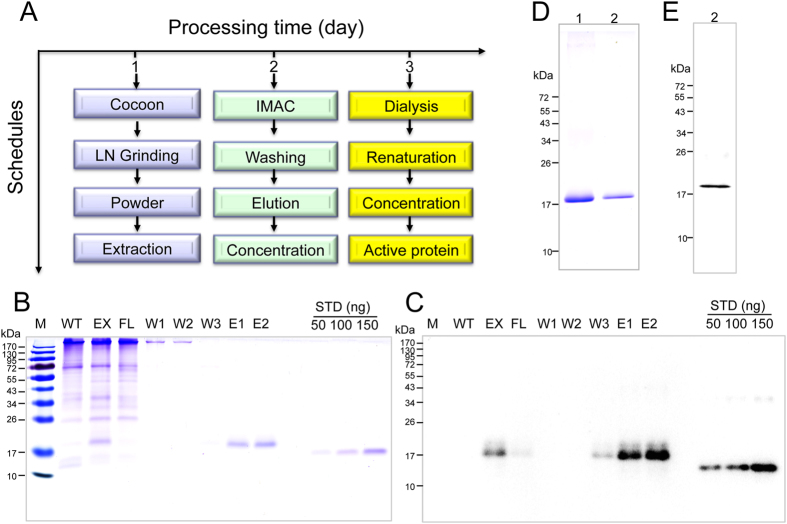
Figure 3. Purification of the haFGF proteins from the cocoons of transgenic silkworm.
(A) Flow diagram of the processes in purifying haFGF proteins from the cocoons of transgenic silkworms. (B,C) SDS–PAGE and western blot analysis of the haFGF in each purification process. EX represents the total supernatant extracts of the transgenic cocoon. FL represents the constituents flowing through the Ni charged his-binding column. W1, W2 and W3 represent the three gradient washing steps by 10 mM, 20 mM and 80 mM imidazole, respectively. E1, E2 represent the eluted haFGF by buffer containing 200 mM imidazole or 1 M imidazole, respectively. The yield of the purified haFGF was calculated by comparing the immunoblot band intensity with the FGF1 standard. (D,E) Analysis of the 200 ng (lane2) and 2 ug (lane1) of pure haFGF by SDS–PAGE and western blot, respectively.

