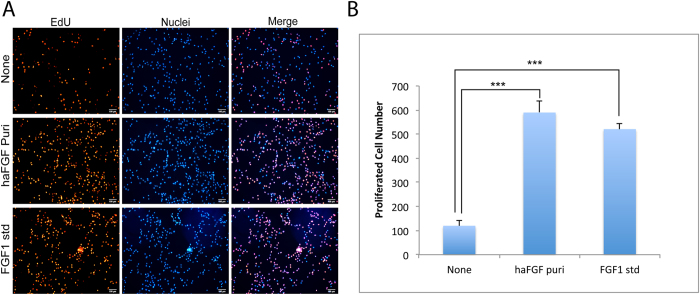
Figure 5. EdU incorporation of NIH/3T3 cells treated with purified haFGF and a haFGF standard compared to controls.
Cell nuclei were stained by hoechst 33342 dye. The scale bar represents 100 μm. Asterisks indicate statistical significance based on Student’s t-test (*p < 0.05, **p < 0.01, ***p < 0.001).

