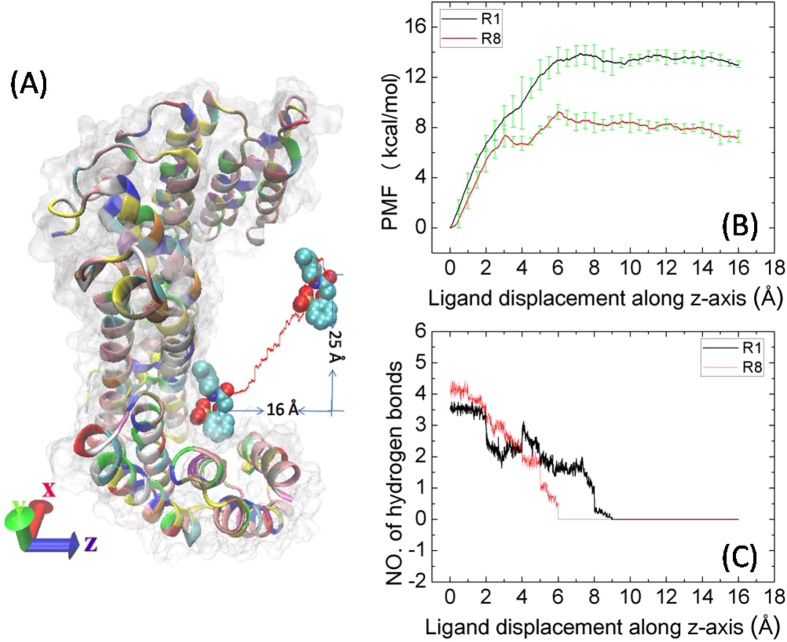
Figure 7.
(A) Pulling compound R1 from its bound state to dissociated state. The 14-3-3σ protein is shown in a cartoon and a surface representation; Inhibitor R1 is shown in a ball representation. The pulling path is shown in red line. (B) PMFs as a function of the inhibitor displacement from its binding site along the pulling path. (C) The averaged number of hydrogen bonds formed between the 14-3-3σ protein and its inhibitor as a function of the inhibitor displacement.

