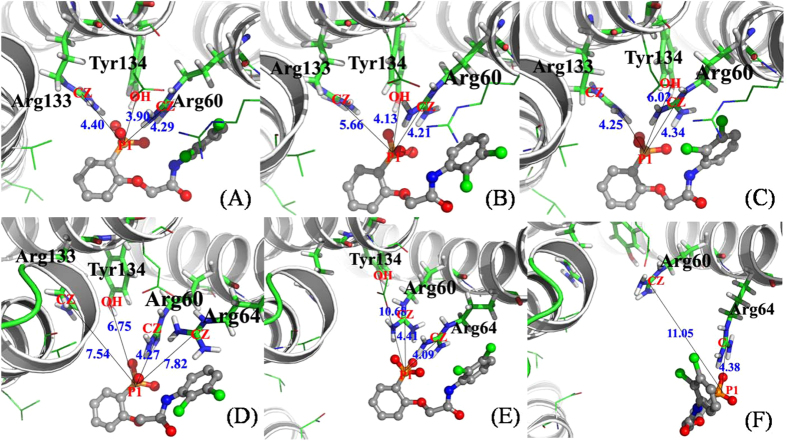
Figure 8. Schematic view of the key distances between the inhibitor R1 and the 14-3-3σ protein.
The 14-3-3σ protein are shown in new cartoon representation, and the inhibitors are shown in stick representation and colored by name of atom. Plots (A,B,E and F) show the conformations for the center of inhibitor R1 at 1 Å, 3.5 Å, 4.0 Å, and 7.0 Å, respectively. Plots (C,D) show the conformations from different SMD trajectories for the center of inhibitor R1 at 2.5 Å. The distances, which can be used to characterize the hydrogen bond, are shown with line in black color.

