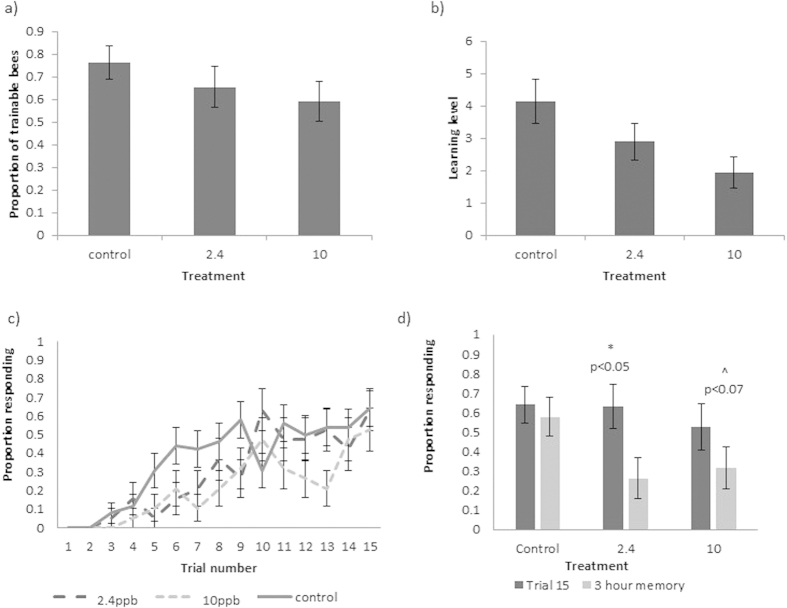
Figure 2. Results from experiment 2: chronic exposure.
(a) The mean proportion of bees in each chronic treatment group that were trainable (trainability). (b) The mean number of conditioned responses of all chronically exposed bees per treatment group (learning level). (c) Acquisition curves showing the mean proportion of chronically exposed bees responding with a proboscis extension to the conditioned odour prior to reward over 15 conditioning trials. (d) Memory recall of the conditioned association (illustrated by mean proportion of bees that showed the conditioned response to the presented odour on trial 15 (dark grey bars) and 3 hours after the learning task in the memory test (light grey bars)) from trainable bees). Letters indicate significant differences (p < 0.05) and error bars show SE.

