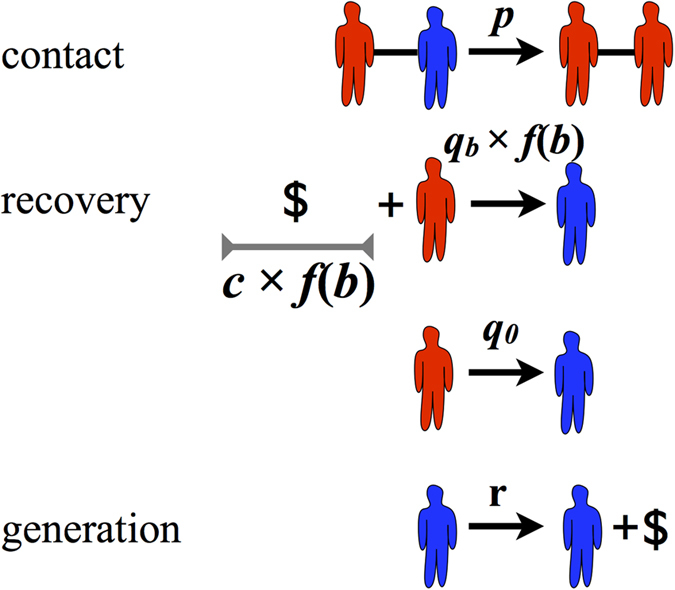
Figure 1. The bSIS model.

The four transitions that describe the bSIS model, each occurring at the rate denoted above the transition arrow. As in the SIS model, infected (red) individuals contact and infect susceptible (blue) neighbors at rate p. Infected individuals will recover at a resource mediated recovery rate qb f(b) if the necessary resources cf(b) are applied, and with an additional baseline rate q0, independent of resource availability. A unit of budget (denoted by the $ sign) is generated by each susceptible at a rate r. Without loss of generality we have normalized the model so that one unit of budget is generated by every individual per unit of time and thus r = 1. (Little men courtesy of Alejandro Morales Gallardo.)
