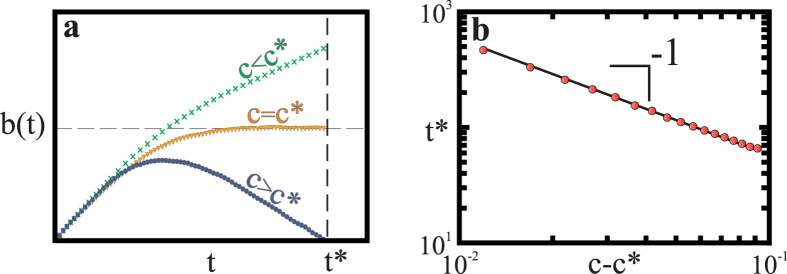
Figure 3. The time dynamics of the budget according to the cost of recovery.
(a) Three different regimes of time-dependent budget development b(t), depending on the healing cost c. (Other parameters are fixed at values q0 = 0, qb = 0.8, p = 0.285.) For healing costs c below the critical cost, c* (green crosses c = 0), the budget is a monotonically increasing function of time. Above the critical cost (c = 2 > c*, blue circles), the budget reaches a maximum and then decreases until it is exhausted at a critical time t = t*, allowing the infection to spread explosively. At the critical cost (c = c* = 0.833, orange inverted triangles), the budget saturates at a non-zero value. (b) The critical time t* at which the budget is exhausted scales with the distance to the critical cost c* according to t* ~ (c − c*)−1 (averaged over 3600 samples). Parameters are fixed at values q0 = 0, qb = 0.8, p = 0.287.

