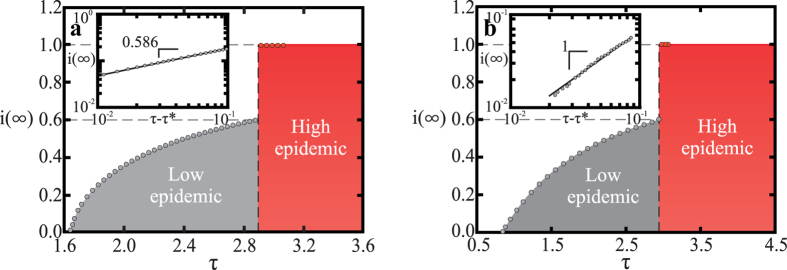
Figure 4. Discontinuous transition from the low to the high epidemic regime.
(a) Asymptotic fraction of infected individuals i(∞) on a square lattice with 10242 sites (we consider a von Neumann neighborhood, which has k = 4 neighbors), for fixed costs c = 0.833, and recovery rate qb = 0.8, as a function of τ (we vary p, and hold k and qb fixed). A discontinuous transition from the low (grey) to the high epidemic regime (red) is observed. The inset shows the approach of i(∞) to τ* = 1.6488 ± 0.0001, confirming the predicted power-law scaling. The black solid line is a guide to the eye, corresponding to (c − c*)β, where β = 0.586 ± 0.014 is the critical exponent of the order parameter for the SIS model on the square lattice. The values of τ* and β where obtained from ref. 39. (b) Same as in (a) but on the friendship network, where the average number of neighbors is 〈k〉 = 8.2355. The inset shows that in the epidemic regime i(∞) ~ (τ − τ*), just as in the mean-field limit of the SIS model32. (Results are averages over 3600 samples.)

