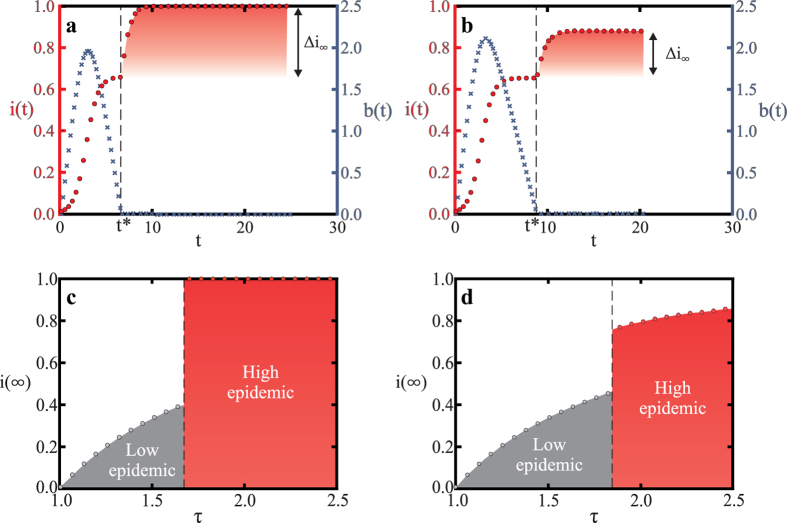
Figure 5. Generalizing results to the case with a baseline recovery rate independent of budget.
(a) Evolution of the fraction of infected individuals i(t) (red circles) and the budget b(t) (blue crosses) in the mean-field model with the same average degree as the friendship network (〈k〉 ≈ 8.2355). All parameters are as in the simulation on the friendship network shown in Fig. 2b: most importantly healing costs are above the critical cost (c = 2 > c* ≈ 0.833) and all healing requires a budget contribution (qb = 0.8 and q0 = 0). Clearly the mean-field behavior is very similar to that in the friendship network. (b) Mean-field model with a baseline recovery rate q0 = 0.2 and qb = 0.6 (q = q0 + qb = 0.8 as above). The behavior is similar to (a) but Δi∞ is smaller due to the baseline recovery. The steady state infection level i(∞) is bounded from above by  (the steady state infection in the pure SIS model with recovery rate q = q0 = 0.2). (c) The discontinuous phase transition observed for parameters in (a) as τ increases (by varying p). (d) Similarly, the phase transition observed for the model in panel (b). Although i(∞) increases continuously with τ after the phase transition, the jump at τ* is clearly discontinuous.

