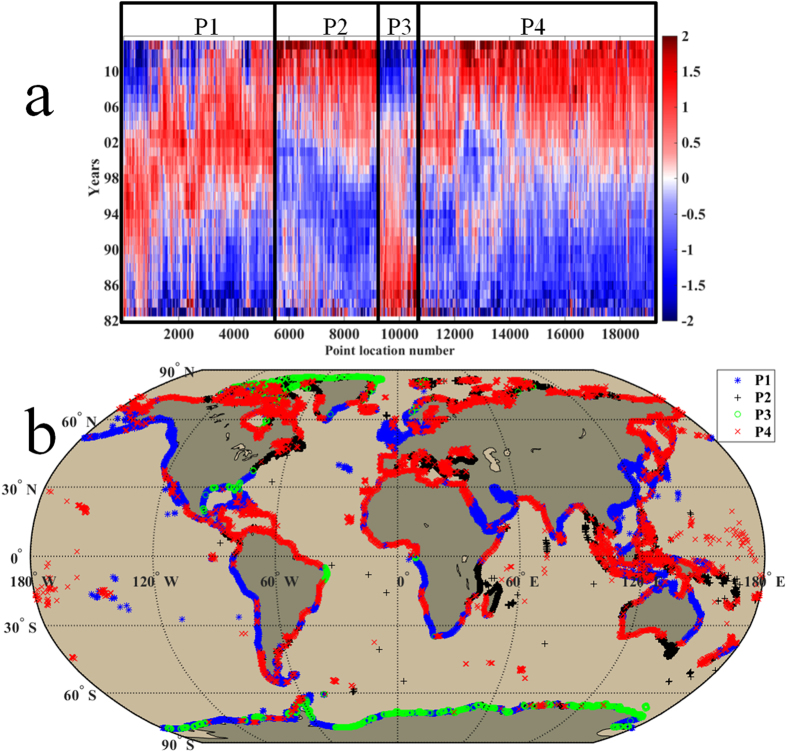
Figure 1. The time series of standardized yearly SST and four changing patterns.
(a) The time series of standardized yearly SST at each coastal location (total 19276), sorted by four changing patterns. (b) The distribution of four changing patterns along the world’s coastlines. The first pattern is that the SST increased in the warming period (1982–1997), then decreased in the hiatus period (1998–2013), which is P1 in the panel a and blue star mark in the panel b. The second pattern is SST decreased in the first period, then increased in the second period, which is P2 in the panel a and black plus mark in the panel b. The third pattern is SST continued decreasing, which is P3 in the panel a and green circle mark in the panel b. The fourth pattern is SST continued increasing, which is P4 in the panel a and red x mark in the panel b. See Method section for the methods to obtain the yearly SST time series. We generated the two sub-panels (a,b) using Matlab and integrated the sub-panels into this figure.

