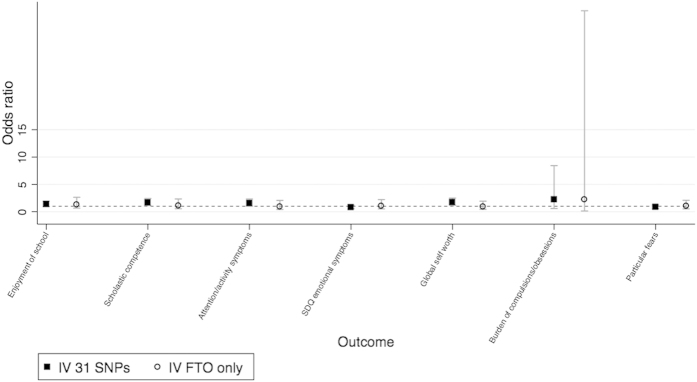
Figure 5. Testing invalidity of IV assumptions: associations of two instrumental variables using distinct SNP subsets, of binary outcomes.
Odds ratio between outcome groups, for a 1 SD change of log BMI aged 8. Comparison between the SNP subsets: (1) 31 SNPs (excluding FTO SNP) and (2) the FTO SNP only. IV estimate of effect using two-stage least squared regression of log BMI at age 8 as the exposure. Graphical illustration of the results in Table 5. Categories for binary variables are given in Supplementary Table 7.

