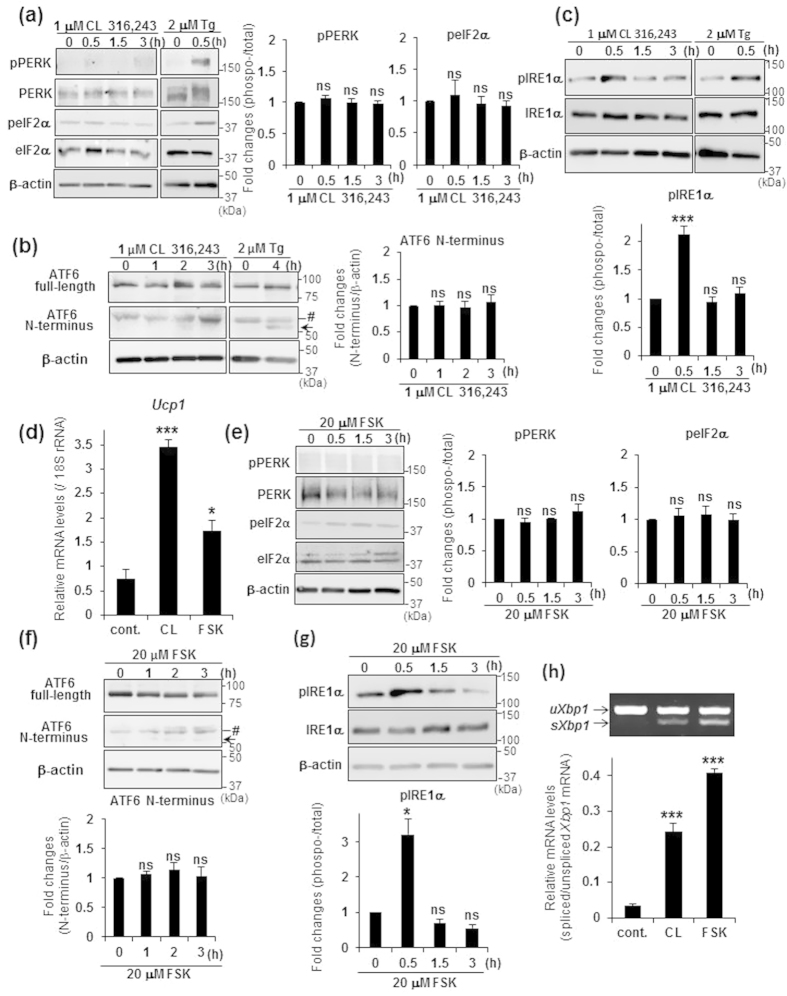
Figure 2. IRE1α was predominantly activated by treatment with β3-AR agonist or forskolin.
(a–c) WB analysis of PERK, eIF2α (a), ATF6 (b), and IRE1α (c) in brown adipocytes treated with either 1 μM CL 316,243 or 2 μM Tg for indicated time periods. Black arrow and Mark (#) indicate ATF6 N-terminus and non-specific detections, respectively. β-actin was used as a loading control. Graphs show the ratio of phosphorylated to total PERK, eIF2α, or IRE1α, and the amount of ATF6 N-terminus. Note that phosphorylation of IRE1α was significantly increased by treatment with CL 316,243. Differences with and without treatment were analyzed by Student’s t-test. Data are mean ± S.D. (n = 4), ***P < 0.001, ns: not significant. (d) Real-time PCR analysis of Ucp1 in brown adipocytes treated with either 1 μM CL 316,243 (CL) or 20 μM forskolin (FSK) for 3 h. Differences with and without treatment were analyzed by Student’s t-test. Data are mean ± S.D. (n = 3), *P < 0.05, ***P < 0.001. cont.: control. (e–g) WB analysis of PERK, eIF2α (e), ATF6 (f), and IRE1α (g) in brown adipocytes treated with 20 μM FSK for indicated time periods. Black arrow and Mark (#) indicate ATF6 N-terminus and non-specific detections, respectively. β-actin was used as a loading control. Graphs show the ratio of phosphorylated to total PERK, eIF2α, or IRE1α, and the amount of ATF6 N-terminus. Differences with and without treatment were analyzed by Student’s t-test. Data are mean ± S.D. (n = 4), *P < 0.05, ns: not significant. (h) RT-PCR analysis of Xbp1 in brown adipocytes treated with either 1 μM CL 316,243 (CL) or 20 μM forskolin (FSK) for 3 h (upper panel). Lower graph is the quantification of Xbp1 splicing levels. Differences with and without treatment were analyzed by Student’s t-test. Data are mean ± S.D. (n = 3), ***P < 0.001. cont.: control.

