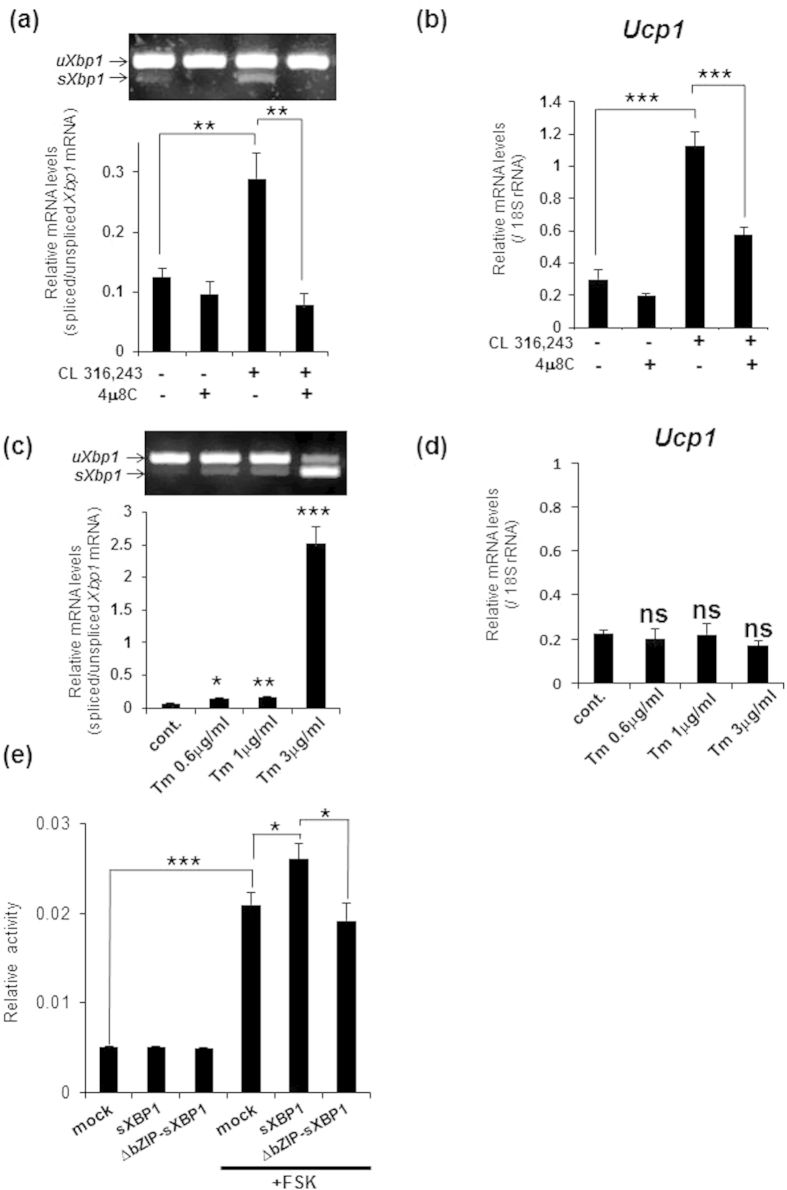
Figure 3. The IRE1α-XBP1 pathway plays a crucial role in the transcriptional induction of Ucp1.
(a) RT-PCR analysis of Xbp1 in brown adipocytes that were pre-treated with 30 μM 4 μ8 C for 30 min and then stimulated with 1 μM CL 316,243 for 3 h (upper panel). Lower graph is the quantification of Xbp1 splicing levels. (b) Real-time PCR analysis of Ucp1 in brown adipocytes treated with 4 μ8 C and CL 316,243 described as (a). Note that treatment with 4 μ8 C significantly decreased Ucp1 expression induced by CL 316,243. Data are mean ± S.D. (n = 5), **P < 0.01, ***P < 0.001. (c) RT-PCR analysis of Xbp1 in brown adipocytes that were treated for 3 h with tunicamycin (Tm) at the indicated concentrations (upper panel). Lower graph shows the quantification of Xbp1 splicing levels. (d) Real-time PCR analysis of Ucp1 in brown adipocytes treated with Tm described as (c). Differences with and without treatment were analyzed by Student’s t-test. Data are mean ± S.D. (n = 3), *P < 0.05, **P < 0.01, ***P < 0.001, ns: not significant, cont.: control. (e) Luciferase assay using C3H10T1/2 cells that were transfected with vectors expressing sXBP1 or ΔbZIP-sXBP1, and then treated with 20 μM forskolin (FSK) for 8 h. Note that the increase in the reporter activity by sXBP1 expression and FSK treatment was higher than the activity by FSK treatment alone. Data are mean ± S.D. (n = 6), *P < 0.05, ***P < 0.001.

