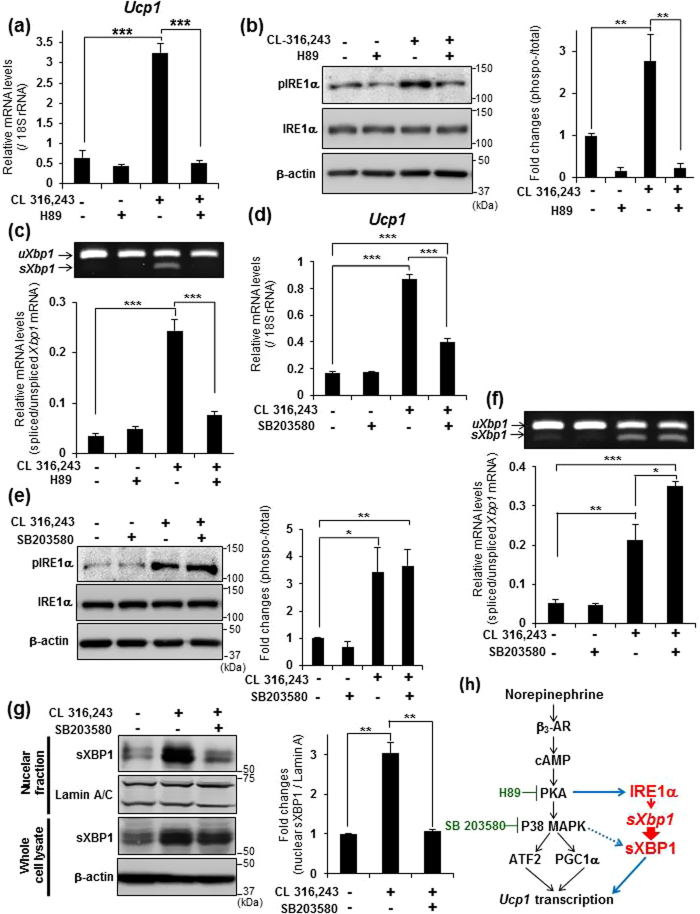
Figure 4. The IRE1α-XBP1 pathway is induced depending on PKA activities.
(a) Real-time PCR analysis of Ucp1 in brown adipocytes that were pre-treated with 40 μM H89 for 1 h, and then stimulated with 1 μM CL 316,243 for 3 h. (b) WB analysis of IRE1α in brown adipocytes that were pre-treated with 40 μM H89 for 1 h, and then stimulated with 1 μM CL 316,243 for 30 min. Graph on right shows the ratio of phosphorylated to total IRE1α. β-actin was used as a loading control. (c) RT-PCR analysis of Xbp1 in brown adipocytes treated with H89 and CL 316,243 described as (a) (upper panel). Lower graph shows the quantification of Xbp1 splicing levels. Data are mean ± S.D. (n = 4), **P < 0.01, ***P < 0.001. (d) Real-time PCR analysis of Ucp1 in brown adipocytes that were pre-treated with 20 μM SB203580 for 30 min, and then stimulated with 1 μM CL 316,243 for 3 h. (e) WB analysis of IRE1α in brown adipocytes that were pre-treated with 20 μM SB203580 for 30 min, and then stimulated with 1 μM CL 316,243 for 30 min. Graph on right shows the ratio of phosphorylated to total IRE1α. β-actin was used as s loading control. (f) RT-PCR analysis of Xbp1 in brown adipocytes treated with SB203580 and CL 316,243 described as (d) (upper panel). Lower graph shows the quantification of Xbp1 splicing levels. Data are mean ± S.D. (n = 5), *P < 0.05, **P < 0.01, ***P < 0.001. (g) WB analysis of sXBP1 in the nuclear fraction or whole cell lysate of brown adipocytes that were pre-treated with 20 μM SB203580 for 1 h, and then treated with 1 μM CL 316,243 for 4 h. All samples were simultaneously treated with 10 μM MG132 for 4 h. Graph on right shows the amount of nuclear sXBP1. β-actin was used as loading control for whole cell lysates and Lamin A/C for the nuclear lysates. Data are mean ± S.D. (n = 3), **P < 0.01. (h) Our model of the transcriptional induction of Ucp1 in brown adipocytes stimulated by norepinephrine.

