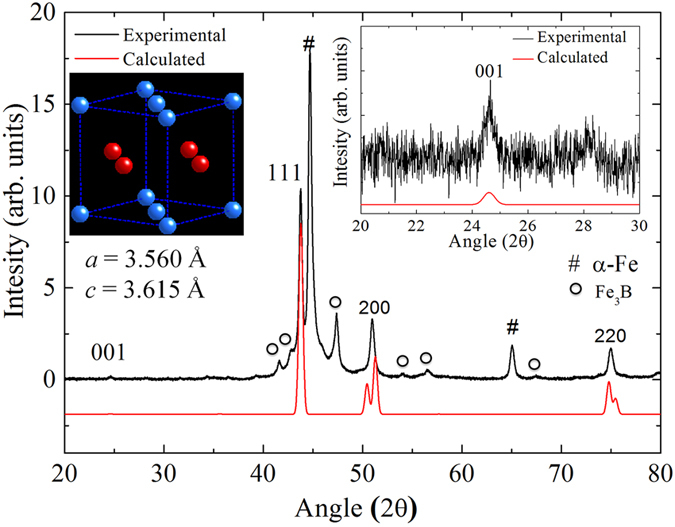
Figure 1. Experimental (black) and calculated X-ray diffraction patterns (red) of the L10 phase.

Right inset is a magnified graph at 2θ ranging from 20 to 30 degrees for the (001) super-lattice diffraction. Left inset demonstrates the atomic arrangements of the L10 phase with Fe (blue) and Ni (red) atoms drawn with lattice parameters of a = 3.560 and c = 3.615 Å.
