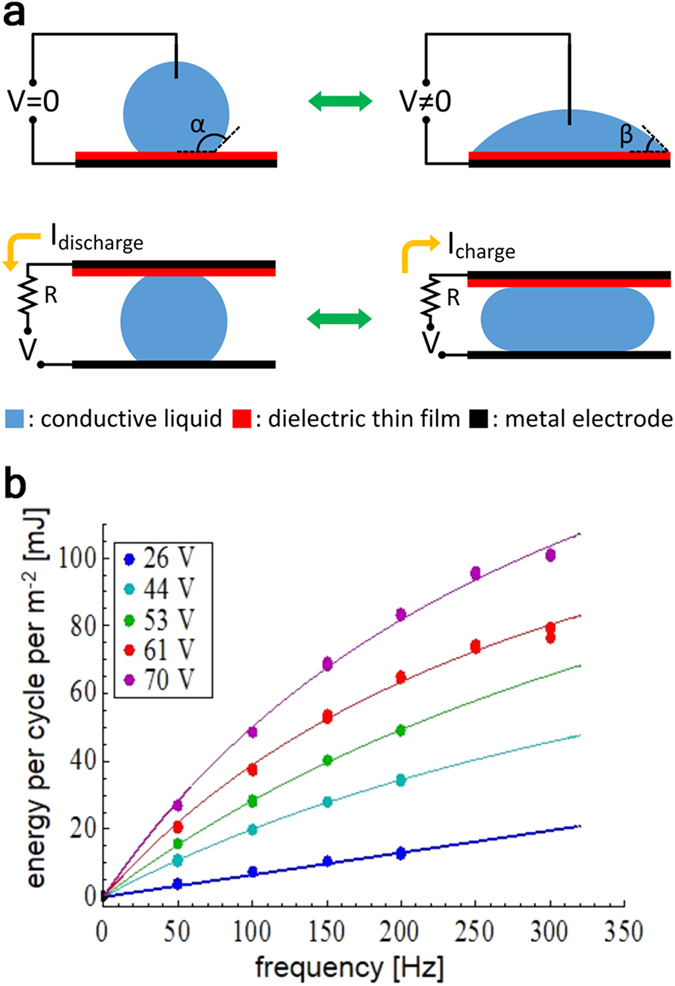
Figure 1. EWOD and REWOD concepts.

(a) Schematics of the EWOD and REWOD process. The energy is generated during the contact area change. (b) Typical results for the energy generated per unit area per one oscillation cycle as a function of the oscillation frequency. Dots represent the actual experimental data; solid lines represent the best fit2.
