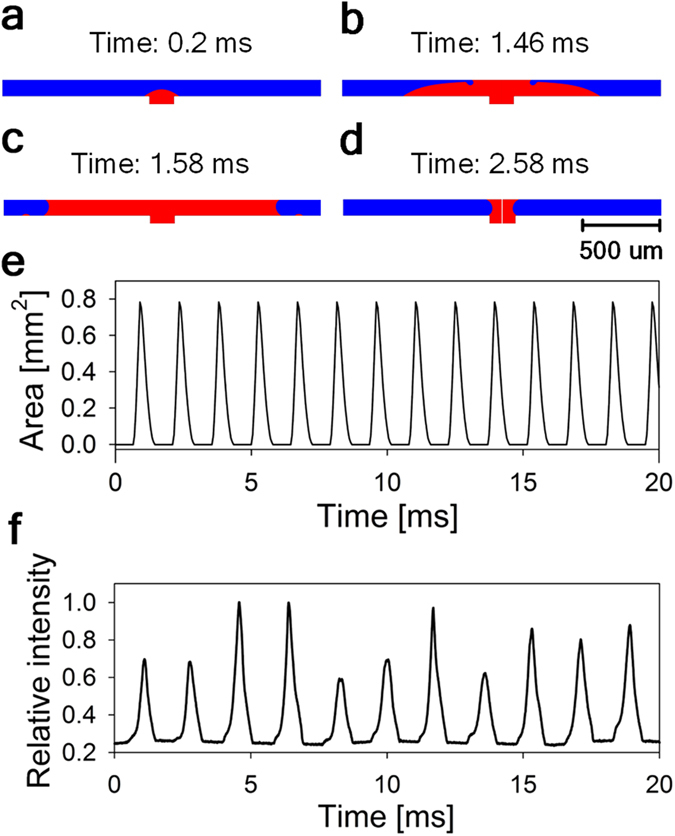
Figure 4. Theoretical and experimental investigation of the bubble dynamics.

(a–d) CFD simulation of the bubble growth and collapse process. Red color indicates the volume occupied by the air, and blue color represents the volume occupied by the mercury. (e) The results of the CFD modeling for the area occupied by air. For this simulation the gauge pressures at the air inlet (PAir - PHg) and at the mercury (PHg) were 0.08 bar and 0.08 bar, respectively. The predicted oscillation period was about 1.4 ms. (f) Experimental results for the relative light intensity vs. time. The obtained oscillation period is about 1.7 ms.
