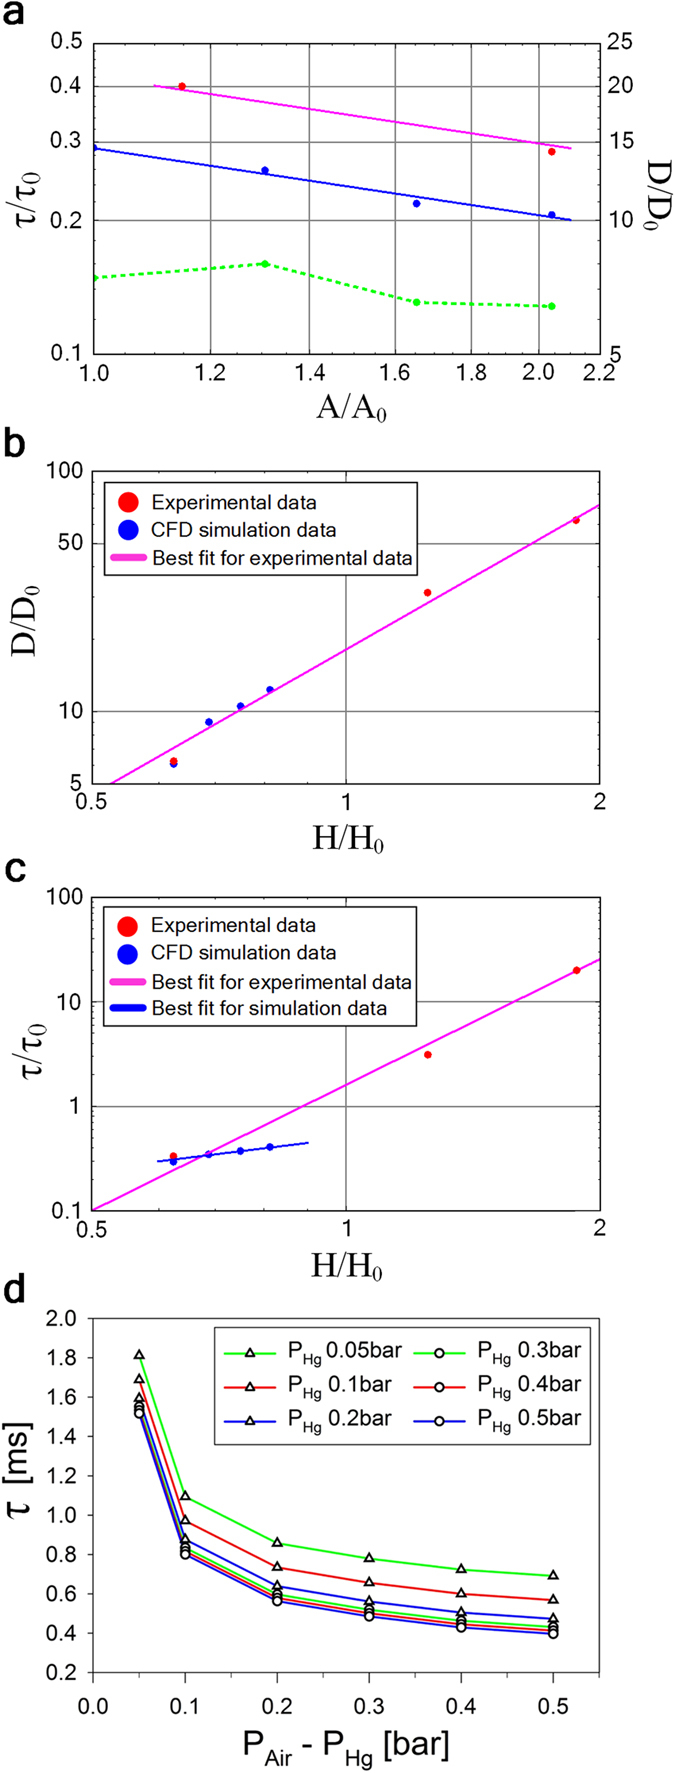
Figure 5. Theoretical investigation of the bubble growth and collapse process.

(a) CFD simulation and experimental results for the bubble oscillation period τ and the maximum bubble expansion diameter D as a function of the inlet cross-sectional area A. Blue dots represent simulation results for the bubble oscillation period τ , while the blue line represents the best fit of the form τ ~ A−1/2. Red dots represent experimental results for the bubble oscillation period τ, while the magenta line represents the best fit of the form τ ~ A−1/2. Green dots represent simulation results for the maximum bubble expansion diameter D. The dashed green line is to guide the eye only. The following values are used: τ0 = 10 ms, D0 = 0.16 mm, A0 = 0.0154 mm2. (b) CFD simulation and experimental results for the maximum bubble expansion diameter D as a function of the gap H between the membrane and the electrode. Blue dots represent simulation results for the maximum bubble expansion diameter D. Red dots represent experimental results for the maximum bubble expansion diameter D, while the magenta line represents the best fit of the form D ~ H2. The following values are used: τ0 = 10 ms, H0 = 0.16 mm. (c) CFD simulation and experimental results for the bubble oscillation period τ as a function of the gap H between the membrane and the electrode. Blue dots represent simulation results for the bubble oscillation period τ , while the blue line represents the best fit of the form τ ~ H. Red dots represent experimental results for the bubble oscillation period τ , while the magenta line represents the best fit of the form τ ~ H4. The following values are used: H0 = D0 = 0.16 mm. (d) The dependence of the bubble oscillation period τ on the mercury and air inlet pressures, PHg and PAir respectively. The solid lines are to guide the eye only.
