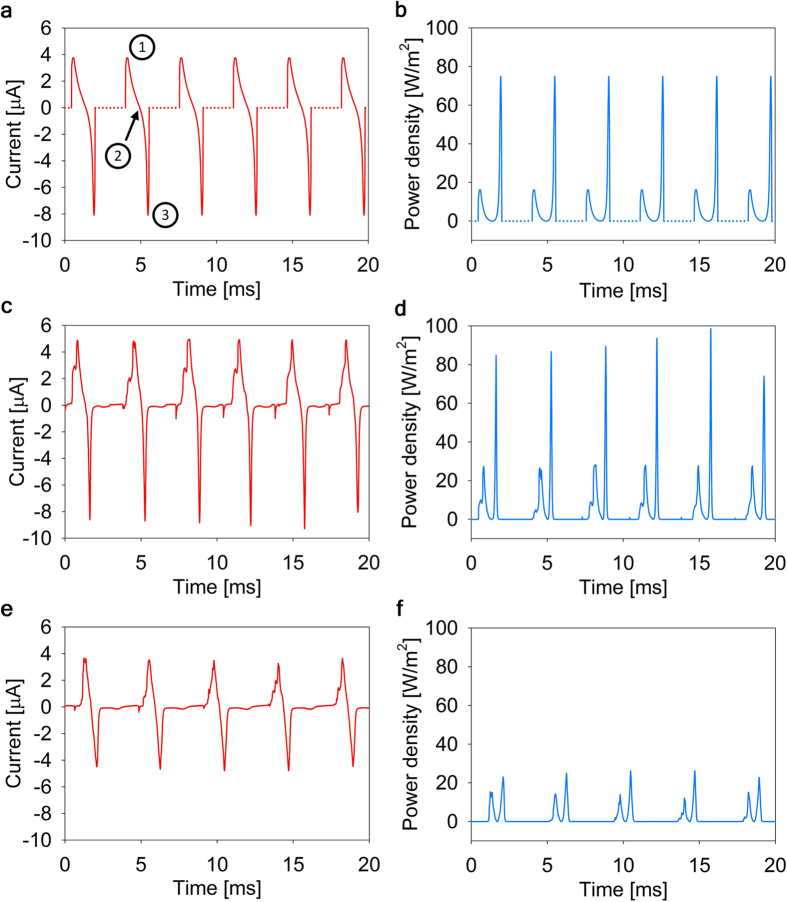
Figure 7. Theoretical and experimental investigation of the bubbler electrical performance.
(a) Theoretical prediction of the current flowing through the load resistor. (1) denotes the bubble collapse process, (2) the beginning of the bubble growth process, and (3) the final stage of the growth process where the bubble footprint exceeds the electrode. (b) Theoretical prediction of the power generated on the load resistor. (c) Experimental results for the current flowing through the load resistor at bias voltage of 4.5 V. (d) Experimental results for the power generated on the load resistor at bias voltage of 4.5 V. (e) Experimental results for the current flowing through the load resistor at bias voltage of 3 V. (f) Experimental results for the power generated on the load resistor at bias voltage of 3 V.

