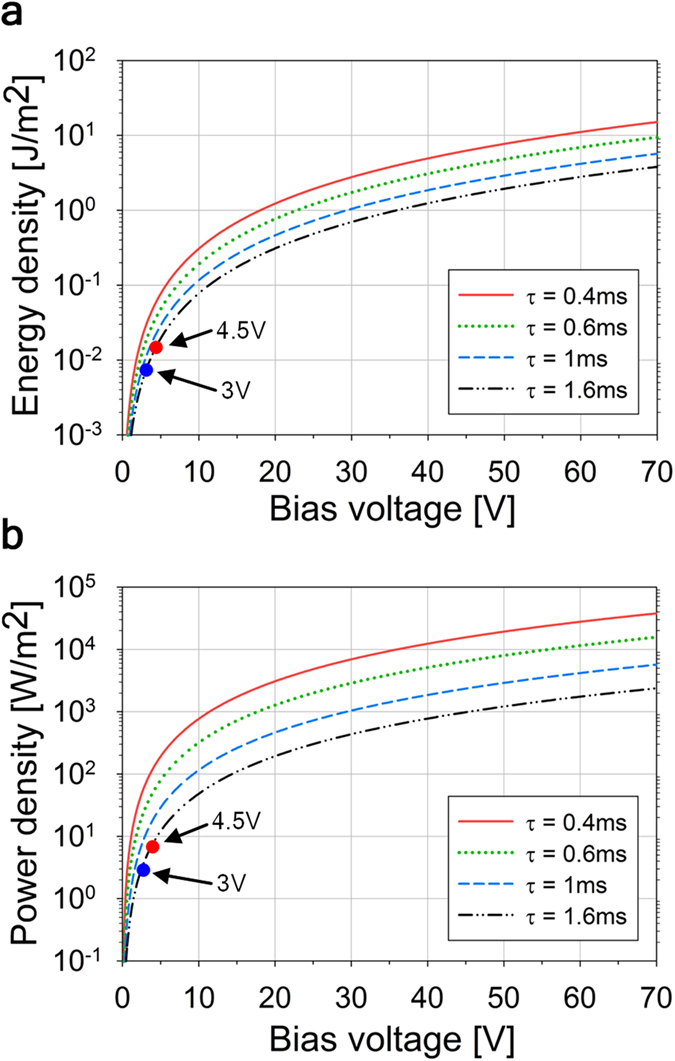
Figure 8. Bubbler power generation predictions.

(a) Projected energy per unit area obtained during one oscillation event as a function of the oscillation period τ and the applied bias voltage. (b) Projected average power per unit area as a function of the oscillation period τ and the applied bias voltage. The large red and blue dots represent the obtained experimental results.
