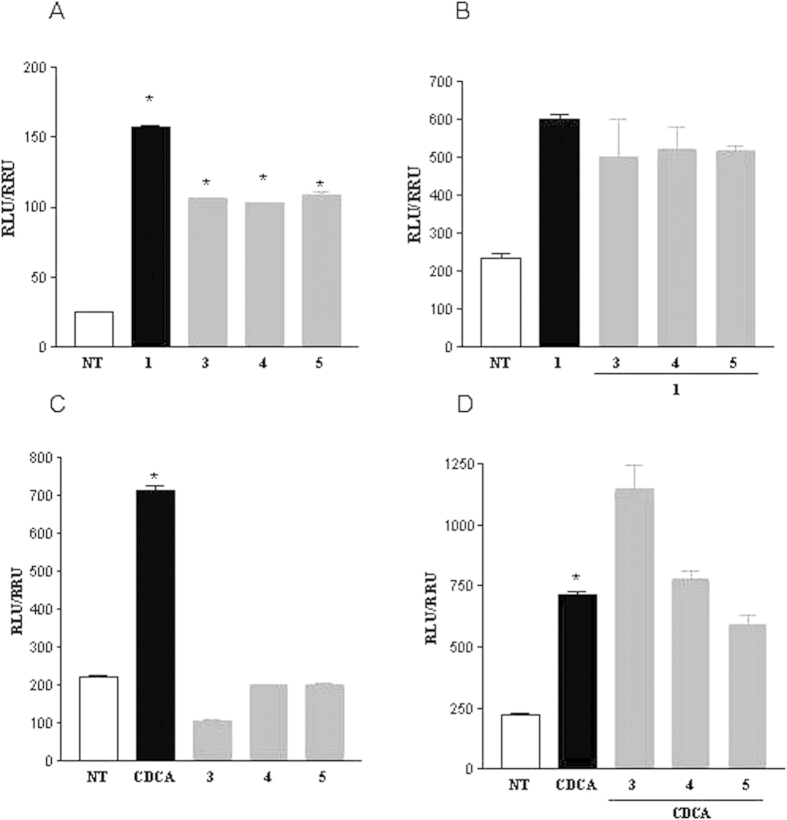
Figure 6. Transactivation assays on GPBAR1 (A,B) and FXR (C,D).
Transactivation assays on GPBAR1. (A) HEK-293T cells were cotransfected with GPBAR1 and a reporter gene containing a cAMP responsive element in front of the luciferase gene. Cells were stimulated 18 h with compounds 3, 4, and 5 at 10 μM and TLCA (10 μM) was used as a positive control. (B) To evaluate antagonistic activity of compounds 3, 4 and 5 cells were stimulated 18 h with 50 μM 3, 4 and 5 in the presence of TLCA (10 μM). Results are expressed as mean ± standard error; *p < 0.05 versus not treated cells (NT). (C,D) Transactivation assays on FXR. (C) HepG2 cells were transfected with pSG5-FXR, pSG5-RXR, p(hsp27)TKLUC and pGL4.70 vectors. Cells were stimulated 18 h with 3, 4 and 5 at 10 μM and CDCA (10 μM) was used as a positive control. (D) Cells were stimulated for 18 h with 50 μM 3, 4 and 5 in the presence of CDCA (10 μM). Results are expressed as mean ± standard error; *p < 0.05 versus not treated cells (NT).

